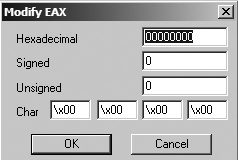
.. You can then change the value.Stack window ❸. This window shows the current state of the stack in memory for the thread being debugged. This window will always show the top of the stack for the given thread. You can manipulate stacks in this window by right-clicking a stack location and selecting Modify. OllyDbg places useful comments on some stack locations that describe the arguments placed on the stack before an API call. These aid analysis, since you won’t need to figure out the stack order and look up the API argument ordering.
Memory dump window ❹. This window shows a dump of live memory for the debugged process. Press CTRL-G in this window and enter a memory location to dump any memory address. (Or click a memory address and select Follow in Dump to dump that memory address.) To edit memory in this window, right-click it and choose Binary ▶ Edit. This can be used to modify global variables and other data that malware stores in RAM.
Stack window ❸. This window shows the current state of the stack in memory for the thread being debugged. This window will always show the top of the stack for the given thread. You can manipulate stacks in this window by right-clicking a stack location and selecting Modify. OllyDbg places useful comments on some stack locations that describe the arguments placed on the stack before an API call. These aid analysis, since you won’t need to figure out the stack order and look up the API argument ordering.
Memory dump window ❹. This window shows a dump of live memory for the debugged process. Press CTRL-G in this window and enter a memory location to dump any memory address. (Or click a memory address and select Follow in Dump to dump that memory address.) To edit memory in this window, right-click it and choose Binary ▶ Edit. This can be used to modify global variables and other data that malware stores in RAM.


