shows a collection of procmon events that occurred on a machine running a piece of malware named mm32.exe. Reading the Operation column will quickly tell you which operations mm32.exe performed on this system, including registry and file system accesses. One entry of note is the creation of a file C:\Documents and Settings\All Users\Application Data\mw2mmgr.txt at sequence number 212 using CreateFile. The word SUCCESS in the Result column tells you that this operation was successful.. When setting a filter, first select a column to filter on using the drop-down box at the upper left, above the Reset button. The most important filters for malware analysis are Process Name, Operation, and Detail. Next, select a comparator, choosing from options such as Is, Contains, and Less Than. Finally, choose whether this is a filter to include or exclude from display. Because, by default, the display will show all system calls, it is important to reduce the amount displayed., we’re filtering on Process Name and Operation. We’ve added a filter on Process Name equal to mm32.exe that’s active when the Operation is set to RegSetValue.After you’ve chosen a filter, click Add for each, and then click Apply. As a result of applying our filters, the display window shown in the lower image displays only 11 of the 39,351 events, making it easier for us to see that mm32.exe performed a RegSetValue of registry key HKLM\SOFTWARE\Microsoft\Windows\CurrentVersion\Run\Sys32V2Controller (sequence number 3 using RegSetValue). Double-clicking this RegSetValue event will reveal the data written to this location, which is the current path to the malware.
If the malware extracted another executable and ran it, don’t worry, because that information is still there. Remember that the filter controls only the display. All of the system calls that occurred when you ran the malware are captured, including system calls from malware that was extracted by the original executable. If you see any malware extracted, change the filter to display the extracted name, and then click Apply. The events related to the extracted malware will be displayed.
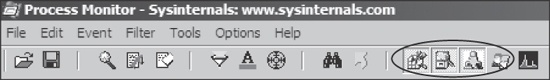
Procmon provides helpful automatic filters on its toolbar. The four filters circled in filter by the following categories:
Registry. By examining registry operations, you can tell how a piece of malware installs itself in the registry.
File system. Exploring file system interaction can show all files that the malware creates or configuration files it uses.
Process activity. Investigating process activity can tell you whether the malware spawned additional processes.
Network. Identifying network connections can show you any ports on which the malware is listening.
All four filters are selected by default. To turn off a filter, simply click the icon in the toolbar corresponding to the category.
Note
If your malware runs at boot time, use procmon’s boot logging options to install procmon as a startup driver to capture startup events.
Analysis of procmon’s recorded events takes practice and patience, since many events are simply part of the standard way that executables start up. The more you use procmon, the easier you will find it to quickly review the event listing.
Назад: Running Malware
Дальше: Viewing Processes with Process Explorer
RegSetValue.After you’ve chosen a filter, click Add for each, and then click Apply. As a result of applying our filters, the display window shown in the lower image displays only 11 of the 39,351 events, making it easier for us to see that mm32.exe performed a RegSetValue of registry key HKLM\SOFTWARE\Microsoft\Windows\CurrentVersion\Run\Sys32V2Controller (sequence number 3 using RegSetValue). Double-clicking this RegSetValue event will reveal the data written to this location, which is the current path to the malware.
If the malware extracted another executable and ran it, don’t worry, because that information is still there. Remember that the filter controls only the display. All of the system calls that occurred when you ran the malware are captured, including system calls from malware that was extracted by the original executable. If you see any malware extracted, change the filter to display the extracted name, and then click Apply. The events related to the extracted malware will be displayed.
Procmon provides helpful automatic filters on its toolbar. The four filters circled in filter by the following categories:
Registry. By examining registry operations, you can tell how a piece of malware installs itself in the registry.
File system. Exploring file system interaction can show all files that the malware creates or configuration files it uses.
Process activity. Investigating process activity can tell you whether the malware spawned additional processes.
Network. Identifying network connections can show you any ports on which the malware is listening.
All four filters are selected by default. To turn off a filter, simply click the icon in the toolbar corresponding to the category.
Note
If your malware runs at boot time, use procmon’s boot logging options to install procmon as a startup driver to capture startup events.
Analysis of procmon’s recorded events takes practice and patience, since many events are simply part of the standard way that executables start up. The more you use procmon, the easier you will find it to quickly review the event listing.
Войти в систему
Войти с помощью соц. сетей:

