Книга: Английский язык. Практический курс для решения бизнес-задач
Назад: Limitations
Дальше: Essential Vocabulary
The GE/McKinsey Matrix
The GE/McKinsey Matrix is a later and more advanced form of the BCG Matrix. It is a model to perform business portfolio analysis on the Strategic Business Units of a corporation. A business portfolio is the collection of SBUs that make up a corporation. The optimal business portfolio is one that fits perfectly to the company’s strengths and helps to exploit the most attractive industries or markets. A SBU can either be a midsize company or a division of a large corporation that formulates its own business level strategy and has separate objectives from the parent company.
The aim of a portfolio analysis is to:
– analyze its current business portfolio and decide which SBUs should be allocated more or less investment;
– develop growth strategies for adding new products and businesses to the portfolio;
– decide which businesses or products should be divested.
The GE/McKinsey Matrix is more sophisticated than the BCG Matrix:
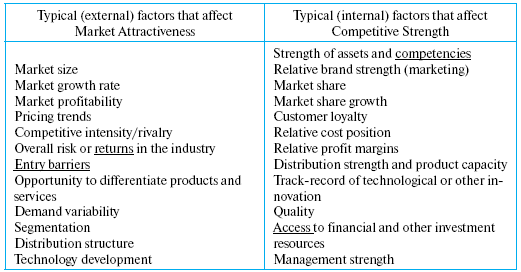
1. Market (industry) attractiveness replaces market growth as the dimension of industry attractiveness. Market attractiveness includes a broader range of factors than just the market growth rate that can determine the attractiveness of an industry/market.
2. Competitive strength replaces market share as the dimension by which the competitive position of each SBU is assessed. Competitive strength likewise includes a broader range of factors than just the market share that can determine the competitiveness of a SBU.
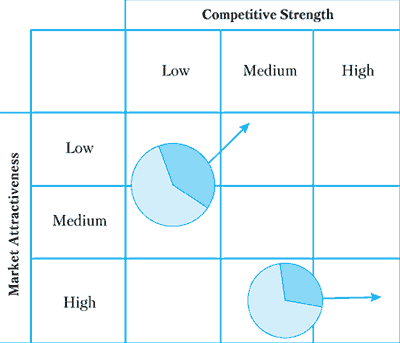
3. The GE/McKinsey Matrix works with a 3*3 grid, while the BCG matrix has only 2*2.
SBUs are portrayed as a circle plotted in the GE/McKinsey Matrix whereby:
– The size of the circles represents the market size
– The size of the pies represents the market share of the SBUs
– Arrows represent the direction and the movement of the SBUs in the future.
A six-step approach to implementation of portfolio analysis using the GE/McKinsey Matrix could look like this:
1. Specify drivers of each dimension.
2. Weight drivers.
3. Score SBU’s each driver.
4. Multiply weights by scores for each SBU.
5. View resulting graph and interpret it.
6. Perform a review/sensitivity analysis using adjusted other weights and scores.
Some important limitations of the GE/McKinsey Matrix are:
– aggregation of the indicators is difficult;
– core competencies are not represented;
– interrelations between SBUs are not considered.
Source: www.valuebasedmanagement.net
Назад: Limitations
Дальше: Essential Vocabulary

