File: pgitops/infra/modules/ekscluster/main.tf
XXXXXXXXXXXXXXX------SNIPPED-------XXXXXXXXXXXXXXXXXXXXX
19:
20: cluster_encryption_config = [{
21: provide r_key_arn = var.kms_key_arn
22: resources = ["secrets"]
23: }]
24:
XXXXXXXXXXXXXXX------SNIPPED-------XXXXXXXXXXXXXXXXXXXXX
L21: Providing reference of the KMS Key ARN, which must be used to
encrypt the data.
L22: Configuring the Kubernetes resources that need to be encrypted;
currently, only “secrets” are supported.
405
Chapter 9 SeCurity and SeCretS ManageMent
9.2.2 Encrypting EKS EBS
EBS is the storage device attached to the EC2 instance, and most
compliance frameworks require it to be encrypted. There are two ways in
which this can be achieved: either using a custom-generated key or using
the AWS-provided key. A custom-generated key will incur cost and also
will require additional permissions. Hence, to keep things simple, I am
using an AWS-provided key by simply initializing the kms_key_id variable
as blank.
Using the following block of code in the EKS module, we can configure
the EBS device.
Code Block 9-8. Encrypting EBS block volume
File: pgitops/infra/modules/ekscluster/main.tf
XXXXXXXXXXXXXXX------SNIPPED-------XXXXXXXXXXXXXXXXXXXXX
66: block_device_mappings = {
67: xvda = {
68: device_name = "/dev/xvda"
69: ebs = {
70: volume_size = 75
71: volume_type = "gp3"
72: iops = 3000
73: throughput = 150
74: encrypted = true
75: kms_key_id = ""
76: delete_on_termination = true
77: }
78: }
79: }
XXXXXXXXXXXXXXX------SNIPPED-------XXXXXXXXXXXXXXXXXXXXX
406
Chapter 9 SeCurity and SeCretS ManageMent
9.2.3 Enhancing EC2 Metadata Security
AWS provides an internal functionality, using which, EC2 instances can
securely obtain privileges to perform actions on behalf of a user/account.
This privilege/permission can be obtained by first fetching the IAM Role by
performing a GET request t
oint. This provides an IAM Role name, which is then used to assume the permissions associated
with it.
All was well until someone figured out that using an SSRF (Server-
Side Request Forgery), this GET request could be spoofed by attackers
with malicious intent. So basically if a web application is vulnerable to
SSRF bug, it opens up the possibility of the attacker gaining access to
the temporary IAM Role permissions and hence accessing your AWS
environment. More on this attack can be read her
.
The IMDSv1 service was heavily abused by attackers to launch SSRF
attacks, and hence, IMDSv2 was released, which fixes this issue.
The following block of code can be utilized to set up the IMDSv2
(Instance Metadata Service) configuration, which is also a major security
requirement.
Code Block 9-9. Configuring all EC2 metadata options for
enabling IMDSv2
File: infra/modules/ekscluster/main.tf
XXXXXXXXXXXXXXX------SNIPPED-------XXXXXXXXXXXXXXXXXXXXX
81: metadata_options = {
82: http_endpoint = "enabled"
83: http_tokens = "required"
84: http_put_response_hop_limit = 2
407
Chapter 9 SeCurity and SeCretS ManageMent
85: instance_metadata_tags = "disabled"
86: }
87: }
XXXXXXXXXXXXXXX------SNIPPED-------XXXXXXXXXXXXXXXXXXXXX
Hence, IMDSv2 avoids this by ensuring that a specific header needs to
be passed in order to call the IMDS endpoint.
For more information on the attack and IMDSv2, refer to this link:
.
9.3 Enhancing AWS ALB Security
Any traffic reaching our application first needs to go through the load
balancer, and hence, ensuring certain security best practices on the
load balancer is very important. In this chapter, we’ll look at how we can
perform a mandatory HTTPS redirection and dropping of invalid header
values to combat specific application attacks. In the next chapter, we’ll look
at how we can store AWS ALB logs in an S3 bucket.
Allowing the website to be served over HTTP, that is, port 80, renders
it vulnerable to man-in-the-middle attacks where attackers can read and
tamper with the data in the request. Hence, it’s most commonly advisable
to have the HTTP port redirect to HTTPS, and the same is achievable
by configuring the following annotation in the ingress resource as
shown here.
Code Block 9-10. Securing ALB against malformed HTTP headers
and HTTPS redirection
File: pgitops/infra/app.tf
233: annotations = {
XXXXXXXXXXXXXXX------SNIPPED-------XXXXXXXXXXXXXXXXXXXXX
408
Chapter 9 SeCurity and SeCretS ManageMent
238: "alb.ingress.kubernetes.io/listen-ports" = "[{\"HTTP\": 80}, {\"HTTPS\":443}]"
239: "alb.ingress.kubernetes.io/actions.ssl-redirect"
= "{\"Type\": \"redirect\", \"RedirectConfig\":
{ \"Protocol\": \"HTTPS\", \"Port\": \"443\",
\"StatusCode\": \"HTTP_301\"}}"
240: "alb.ingress.kubernetes.io/load-balancer-attributes" =
"routing.http.drop_invalid_header_fields.enabled=true"
241: }
242: }
243: spec {
244: rule {
245: host = local.url
246: http {
247: path {
248: backend {
249: service {
250: name = "ssl-redirect"
251: port {
252: name = "use-annotation"
253: }
254: }
255: }
256: path = "/*"
257: }
XXXXXXXXXXXXXXX------SNIPPED-------XXXXXXXXXXXXXXXXXXXXX
274: }
L238: Declaring the ingress to open two listener ports in the AWS Load
Balancer that will be created.
409
Chapter 9 SeCurity and SeCretS ManageMent
L239: This is where we declare the annotation that configures the
redirection logic and the HTTP redirection code, that is, 301, which needs
to be used.
L247–257: The implementation logic of the HTTPS redirection at the
root path “/”.
L240: Having this configuration that is to disable invalid header
fields is very important as it helps in invalidating requests that do not
have proper HTTP headers. This helps in mitigating a class of application
vulnerabilities called HTTP Request Smuggling, which leverages
the desynchronization between the load balancer and its service on
acceptance of the content-length vs. transfer-encoding headers.
More information about this attack can be obtained from
9.4 Restricting RDS Exposure
Currently, our RDS service is exposed to the entire VPC as the security
group that was defined had the entire 10.0.0.0/16 CIDR address. This is
now solved by restricting the security group to allow access to the RDS
server on port 5432 only from the private subnet as shown here.
Code Block 9-11. Restricting AWS RDS access from the
private subnet
File: pgitops/infra/networking.tf
53: module "pgsql_sg_ingress" {
54: source = "./modules/securitygroup"
55:
56: sg_name = "pgsql_sg_ingress"
57: sg_description = "Allow Port 5432 from within the
Private Subnet"
410
Chapter 9 SeCurity and SeCretS ManageMent
58: environment = var.environment
59: vpc_id = module.networking.vpc_id
60: type = "ingress"
61: from_port = 5432
62: to_port = 5432
63: protocol = "tcp"
64: cidr_blocks = var.private_subnets_cidr
65:
66: depends_on = [module.networking]
67: }
L64: This was earlier scoped to the entire VPC and now narrowed
down to only the private subnet where our application is currently
deployed. Hence, only services deployed in this private network will have
access to the RDS database on port 5432.
9.5 Secrets Exposure
Currently, in our application, the most sensitive information is the
database password. Let’s identify the places where this password can be
potentially leaked or visible in clear-text.
9.5.1 Terraform State
If we were to simply grep for the string “password” in our terraform state, it
can reveal various different places where the database password string can
be found.
411
Chapter 9 SeCurity and SeCretS ManageMent
CLI Output 9-12. Searching for the password string in
terraform state
cmd> grep "password" terraform.tfstate
"module.pgsql.random_password.master_password",
"module.ssmr-db-password.data.aws_ssm_parameter.
parameter",
"module.ssmw-db-password.aws_ssm_parameter.ssm_
parameter"
"module.pgsql.random_password.master_password",
"module.ssmr-db-password.data.aws_ssm_parameter.
parameter",
"module.ssmw-db-password.aws_ssm_parameter.ssm_
parameter"
"repository_password": null,
"type": "random_password",
"name": "master_password",
"password": "EvlNUope03cXdIlG",
"value": "password"
If we were to now search for the value of the password string in the
terraform state, we’ll get a better idea of the number of places where the
password is stored in clear-text, a total of five locations as shown here.
CLI Output 9-13. Reverse lookup of the password string to know
occurrences
cmd> grep "EvlNUope03cXdIlG" terraform.tfstate
"value": "EvlNUope03cXdIlG",
"result": "EvlNUope03cXdIlG",
"password": "EvlNUope03cXdIlG",
"value": "EvlNUope03cXdIlG",
"value": "EvlNUope03cXdIlG",
412
Chapter 9 SeCurity and SeCretS ManageMent
Hence, it's extremely important that access to terraform state is
restricted to select few individuals only.
9.5.2 Kubernetes Deployment Descriptions
In the previous chapter, we implemented restrictions on Kubernetes
groups who can read secrets. Other than the administrator, no other
group has the privilege to access the Kubernetes Secrets. However, with
our secrets being embedded as environment variables in the Kubernetes
deployments as shown in the following code on L70–73, all groups who
have the read-only rights to view the deployment configurations can easily
read the database password in clear-text. We shall address this exposure in
the next section.
Code Block 9-14. Password in Kubernetes deployment descriptions
File: pgitops/infra/app.tf
50: spec {
51: container {
52: image = "salecharohit/practicalgitops"
53: name = var.org_name
XXXXXXXXXXXXXXX------SNIPPED-------XXXXXXXXXXXXXXXXXXXXX
66: env {
67: name = "DB_USERNAME"
68: value = var.db_user_name
69: }
70: env {
71: name = "DB_PASSWORD"
72: value = module.ssmr-db-password.ssm-value
73: }
XXXXXXXXXXXXXXX------SNIPPED-------XXXXXXXXXXXXXXXXXXXXX
413
Chapter 9 SeCurity and SeCretS ManageMent
9.6 AWS Secrets Manager
In order to address the problem of database passwords being stored as
clear-text in the deployment descriptions, we’ll need to make use of the
Secrets Store CSI Driver for AWS, more details of which can be found here:
.
9.6.1 Secrets Management Design
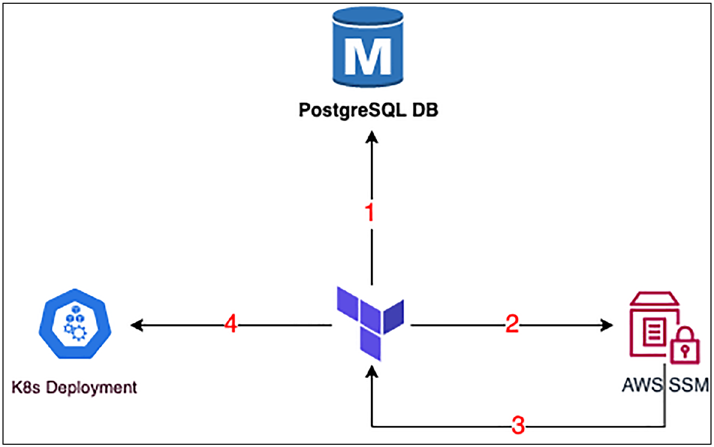
Before we explore the new design, let’s first understand the old one.
Current Solution
Figure 9-2. AWS RDS Secrets Storage - Current Solution
414
Chapter 9 SeCurity and SeCretS ManageMent
1. Terraform generates a random password and stores
it in the Database
2. Once the RDS is setup it writes the password as a
SecureString in AWS SSM
3. Terraform then reads the password from AWS SSM
4. And then writes it into the deployment manifest file
as an environment variable.
So the database secret is embedded in the terraform Kubernetes
manifest file when terraform apply is running.
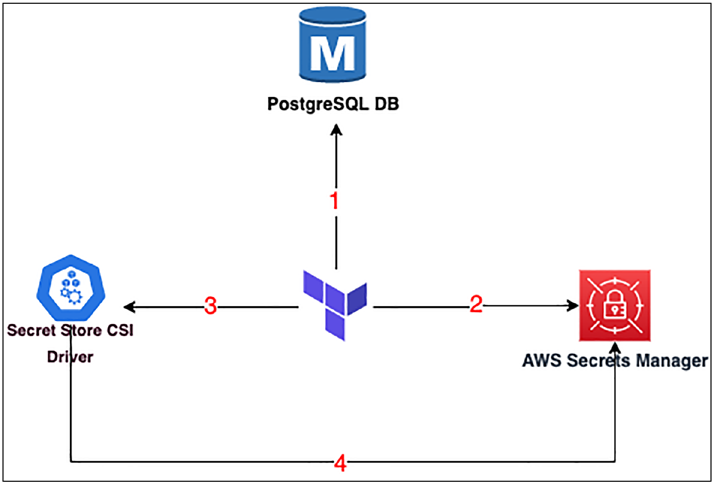
New Solution
Figure 9-3. AWS RDS Secrets Storage – New Solution
415
Chapter 9 SeCurity and SeCretS ManageMent
1. Terraform generates a random password and stores
it in the Database.
2. Once the RDS is set up, it writes the password as in
AWS Secrets Manager.
3. Terraform builds the Kubernetes manifest file
with the name of the key that is used to store the
password in the AWS Secrets Manager, for example,
db_password.
4. Upon successful deployment of the Secrets Store
CSI Driver, it’ll read the password string from AWS
Secrets Manager using the name of the key that
was passed, that is, db_password, and create a
Kubernetes Secrets volume object.
In this design, we are not relying on Terraform to build the manifest
descriptor file of the deployment to inject the secret. Rather, we are using
the Secrets Store CSI Driver to pull the secret from AWS Secrets Manager
and then make it available to the deployment before the deployment starts
its execution.
Note i’m using aWS Secrets Manager in lieu of aWS SSM just to
explore a new service. the Secrets Store CSi driver also works with
aWS SSM.
9.6.2 Secrets Store CSI Driver
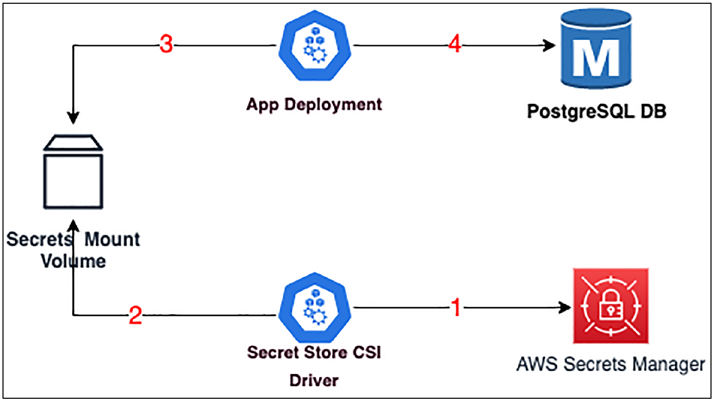
So how does the Secrets Store CSI Driver really work? Let’s understand
using the following diagram.
416
Chapter 9 SeCurity and SeCretS ManageMent
Figure 9-4. An image showing how Secrets Store CSI Driver works
1. The Secrets Store CSI Driver is a deployment
configuration that will read the secrets from the AWS
Secrets Manager from a specified path and location,
for example, db_password.
2. Once it reads the value, it will write it to a secret
mount volume as an object with a name as db-
password-secret.
3. The App deployment will read the db-password-
secret object from the secrets volume and obtain
the database password, which will be stored as an
environment variable. However, this time, since it’s a
mounted volume from where the data is being read,
it won’t be shown in clear-text in the deployment
descriptor. We’ll see this practically when we run the
entire application.
4. The deployment then connects to the RDS database
using the password.
417
Chapter 9 SeCurity and SeCretS ManageMent
Let us now see this entire process being implemented in Terraform as
shown in the following where we’ll first start with how I am defining the
AWS Secrets Manager.
Code Block 9-15. Defining the AWS Secrets Manager
File: pgitops/infra/rds.tf
XXXXXXXXXXXXXXX------SNIPPED-------XXXXXXXXXXXXXXXXXXXXX
86: # Write the DB random password in AWS Secrets Manager
87: module "awssm-db-password" {
88: source = "./modules/awssm"
89:
90: parameter_name = var.db_pwd_parameter_name
91: secret_value = module.pgsql.db_instance_
password
92: description = "DB Password"
93: environment = var.environment
94: deletion_window_in_days = 0
95:
96: depends_on = [module.pgsql]
97: }
XXXXXXXXXXXXXXX------SNIPPED-------XXXXXXXXXXXXXXXXXXXXX
L87–97: We are defining the module AWS SM or AWS Secrets Manager,
which is retrieving the value of the database password on L91 from
the database module. A special note for L90 where we are defining the
parameter name against which the value will be stored as a global variable,
which will be used across different modules/files as we’ll see ahead.
L94: Just like the AWS KMS, secret deletion can be deferred to a certain
period of time; however, for this book, I’ve defined it as 0 days as it creates
issues while destroying the resource. For example, if I set it as 7 days,
418
Chapter 9 SeCurity and SeCretS ManageMent
then this particular resource value cannot be deleted till 7 days, and our
terraform will give error while destruction.
Let’s now look at how we are installing the Secrets Store CSI Driver.
Code Block 9-16. Installing CSI Secrets Driver
File: pgitops/infra/app.tf
XXXXXXXXXXXXXXX------SNIPPED-------XXXXXXXXXXXXXXXXXXXXX
15: data "kubectl_file_documents" "csi_secrets" {
16: content = file("modules/csisecretsdriver/aws-secrets-
csi.yaml")
17: }
18:
19: # Install the CSI Secrets Driver with Secrets Sync Enabled
20: module "csi-secrets-driver" {
21:
22: source = "./modules/csisecretsdriver"
23:
24: count_files = length(data.kubectl_file_documents.
csi_secrets.documents)
25: csi_secrets_version = "1.1.2"
26: k8s_path = "modules/csisecretsdriver/aws-
secrets-csi.yaml"
27: namespace = kubernetes_namespace_v1.app.
metadata.0.name
28:
29: depends_on = [module.eks, resource.kubernetes_
namespace_v1.app]
30:
31: }
XXXXXXXXXXXXXXX------SNIPPED-------XXXXXXXXXXXXXXXXXXXXX
419
Chapter 9 SeCurity and SeCretS ManageMent
L15–17: As discussed earlier, we are using a kubectl provider, which
helps in applying Kubernetes manifest files in YAML format. If we’ve a
single manifest file with a single resource definition, we can always declare
it in the terraform code itself; however, if there are multiple resources
divided by --- (three hyphens), then we need to first count the number of
resources and provide that to the kubectl provider, which is what we are
doing here, and pass this value on L24.
L20–31: Here, we’ve encapsulated the entire procedure of installing
the Secrets Store CSI Driver in a module as it requires installing the driver
using helm and then also separately deploying a DaemonSet, which is
defined in pgitops/ modules/csisecretsdriver/aws-secrets-csi.yaml and
installed using the kubectl provider.
Next, let’s discuss about a custom resource that needs to be created in
addition to the CSI driver and the DaemonSet as shown here.
Code Block 9-17. Deploying Kubernetes Secrets custom resource
definition
File: pgitops/infra/app.tf
XXXXXXXXXXXXXXX------SNIPPED-------XXXXXXXXXXXXXXXXXXXXX
69: resource "kubectl_manifest" "secrets" {
70: yaml_body = <<YAML
71: apiVersion: secrets-store.csi.x-k8s.io/v1alpha1
72: kind: SecretProviderClass
73: metadata:
74: name: aws-secret-application
75: namespace: ${var.org_name}
76: spec:
77: provider: aws
78: secretObjects:
79: - secretName: db-password-secret
420
Chapter 9 SeCurity and SeCretS ManageMent
80: type: Opaque
81: data:
82: - objectName: ${var.db_pwd_parameter_name}
83: key: db_password
84: parameters:
85: objects: |
86: - objectName: ${var.db_pwd_parameter_name}
87: objectType: "secretsmanager"
88: YAML
89:
90: depends_on = [module.pgsql,
91: module.csi-secrets-driver,
92: resource.kubernetes_namespace_v1.app
93: ]
94:
95: }
XXXXXXXXXXXXXXX------SNIPPED-------XXXXXXXXXXXXXXXXXXXXX
L69–70: We are declaring a raw YAML body that needs to be processed
where the term YAML is following the HEREDOC syntax ending on L88.
L71–72: We are defining the custom resource and the API supporting
that resource for Kubernetes.
L74–75: Naming the resource (which will be referenced when
mounting the volume in deployment) and scoping it to the same
namespace that we are using throughout the code, that is, “gitops”.
L78–83: Here, we are declaring the secrets object that will be created
with the name of the secret being db-password-secret defined on L79, which will be referenced in the deployment.
L81–83: Defining the data, that is, the key-value of the secret where the
key is defined by us as db_password, which is the same as how it’s defined
in the AWS Secrets Manager.
421
Chapter 9 SeCurity and SeCretS ManageMent
L84–87: Here, we need to provide the exact reference of the key with
which the value is stored in AWS Secrets Manager, which, as discussed
earlier, is defined as a global variable so we don’t mess up.
L90–93: Note the dependencies here, especially the CSI Secrets Driver.
The custom resource that’s defined L72 would error out if Terraform
attempted to execute this code before the CSI driver would be set up.
From the preceding code, it’s important to note the following
definitions, which will be referenced in the deployment file, which we’ll
explore next:
–
aws-secret-application – Name of the custom resource
that’s defined as SecretProviderClass
–
db-password-secret – Name of the Kubernetes Secret
resource that will be created by this Secret
Provider class
–
db_password – Name of the key that’ll be used for
identifying the secret
Let’s now look at the deployment descriptor file with the portion
relevant for adding the secrets.
Code Block 9-18. Kubernetes deployment descriptor file for
adding secrets
File: pgitops/infra/app.tf
099: resource "kubernetes_deployment_v1" "app" {
XXXXXXXXXXXXXXX------SNIPPED-------XXXXXXXXXXXXXXXXXXXXX
144: env {
145: name = "DB_PASSWORD"
146: value_from {
147: secret_key_ref {
148: name = "db-password-secret"
422
Chapter 9 SeCurity and SeCretS ManageMent
149: key = "db_password"
150: }
151: }
152: }
153:
154: volume_mount {
155: name = "db-password-vol"
156: mount_path = "/mnt/secrets-store"
157: read_only = true
158: }
159:
XXXXXXXXXXXXXXX------SNIPPED-------XXXXXXXXXXXXXXXXXXXXX
186: volume {
187: name = "db-password-vol"
188: csi {
189: driver = "secrets-store.csi.k8s.io"
190: read_only = true
191: volume_attributes = {
192: "secretProviderClass" = "aws-secret-
application"
193: }
194: }
195: }
XXXXXXXXXXXXXXX------SNIPPED-------XXXXXXXXXXXXXXXXXXXXX
200: }
L154–158: Defining the volume mount db-password-vol and loading
data from the path /mnt/secrets-store where the secrets store DaemonSet is storing all the data as Secret Resources.
423
Chapter 9 SeCurity and SeCretS ManageMent
L186–195: Declaring the volume db-password-vol as a CSI driver and
referencing the custom resource definition as aws-secret-application,
which we saw earlier.
L144–152: The environment variable declaration where the DB_
PASSWORD will be populated. The value of the DB_PASSWORD will be
populated from the volume mount and retrieved using the name of the
secret resource, that is, db-password-secret, and the key in that resource whose value needs to be fetched, that is, db_password.
Tip an alternative to this Secrets Store CSi driver approach is
the aWS Secret Sidecar injector, which follows the sidecar pattern
and gets deployed as a sidecar pod along with the application pod
9.7 IRSA
9.7.1 Background
In the previous chapter, we looked at the two different authentication/
authorization mechanisms implemented in EKS, and here, we’ll be
discussing the third type. In AWS, by default, any type of authentication is
done by the access keys and authorization using the IAM Roles/Groups
and the permissions assigned to them. However, there is another way
where the authentication decision can be delegated to a different identity
provider by establishing a trust between them.
Currently, AWS supports two such identity providers, that is, OIDC
(OpenID Connect) and SAML (Security Assertion Markup Language),
which are two different authentication protocols.
424
Chapter 9 SeCurity and SeCretS ManageMent
By setting up an OIDC/SAML IdP (identity Provider), we can
authenticate to these IdPs and then use the authentication token to access
any AWS services. While setting up our EKS cluster, we are setting up this
OIDC endpoint for establishing the trust relationship.
Within Kubernetes, if a pod needs to access any resource, it needs
proper permissions that are defined in the Service Account. A default
service account is always associated with every Kubernetes resource (pods,
deployments, DaemonSets, etc.), which can always be used to authenticate
to the Kube API server.
So now the question is, how can a pod running in AWS EKS access
AWS services?
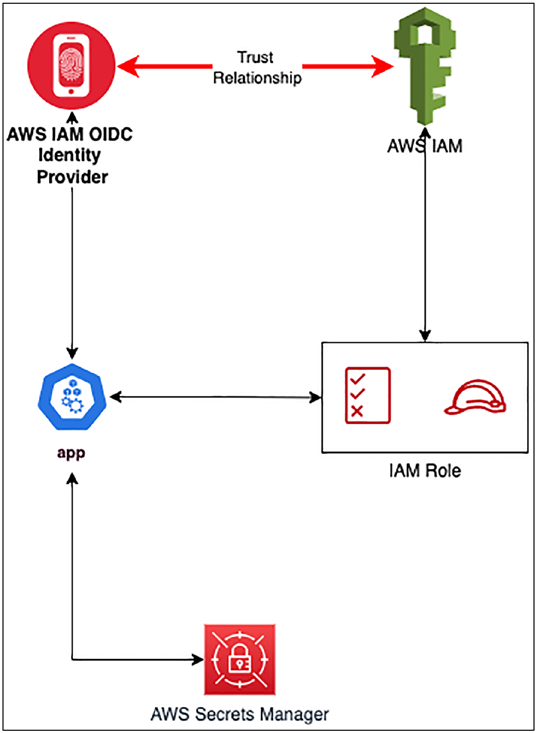
This is where IRSA (IAM Roles for Service Accounts) comes into the
picture, which is an authentication/authorization architecture for EKS
pods to access AWS services by assigning an IAM Role to the service
account token that would be mounted on the pods.
425
Chapter 9 SeCurity and SeCretS ManageMent
9.7.2 Internal Working
Figure 9-5. An image showing how IRSA works internally
• The AWS IAM and OIDC Identity Provider have a trust
relationship established between them.
• Kubernetes Service Account is annotated with the
ARN of an IAM Role, which is then passed to the OIDC
IdP, which validates the IAM Role and provides the
authentication token.
426
Chapter 9 SeCurity and SeCretS ManageMent
• This authentication token is then passed to the AWS
service, which needs to be consumed by the pod.
There are two parts to creating a complete IRSA architecture: an IAM
Assume Role tied to an IAM permissions policy and a Kubernetes Service
account with the ARN of the IAM Role added as an annotation. Let’s look
at how this would be implemented in Terraform.
9.7.3 IAM Permissions Policy
For our pod to be able to access the Secrets from the AWS Secrets Manager,
we need the following permissions policy where we are also restricting
the ARN of the secret that we’ve created. This ensures that this pod is not
able to access any secret other than the one that is explicitly defined in the
policy document on L11.
Code Block 9-19. IAM permissions policy to read a secret from AWS
Secret Manager
File: pgitops/infra/data/secrets.json
01: {
02: "Version": "2012-10-17",
03: "Statement": [
04: {
05: "Sid": "SecretsManagerReadOnly",
06: "Effect": "Allow",
07: "Action": [
08: "secretsmanager:GetSecretValue",
09: "secretsmanager:DescribeSecret"
10: ],
11: "Resource": "${db_password_arn}"
12: }
427
Chapter 9 SeCurity and SeCretS ManageMent
13: ]
14: }
XXXXXXXXXXXXXXX------SNIPPED-------XXXXXXXXXXXXXXXXXXXXX
The IAM permissions policy needs to be created using the resource
definition as shown in the following where we are providing the preceding
policy as a template and providing the database secret ARN to the policy.
Code Block 9-20. Creating the Policy resource
File: pgitops/infra/app.tf
35: resource "aws_iam_policy" "secrets_policy" {
36: name = "secrets_policy"
37: path = "/"
38: policy = templatefile("./data/secrets.json", {
39: db_password_arn = module.awssm-db-password.arn
40: })
41: }
The following module is used to tie the IAM Permissions to an IAM
Role and provide the ARN of this IAM Role as an output, which needs to be
annotated on the Kubernetes service account resource.
Code Block 9-21. Creating the IRSA Role
File: pgitops/infra/app.tf
XXXXXXXXXXXXXXX------SNIPPED-------XXXXXXXXXXXXXXXXXXXXX
43: module "irsa_aws_secrets" {
44: source = "./modules/irsa"
45:
46: oidc_url = module.eks.cluster_oidc_issuer_url
47: oidc_arn = module.eks.oidc_provider_arn
428
Chapter 9 SeCurity and SeCretS ManageMent
48: k8s_sa_namespace = kubernetes_namespace_v1.app.
metadata.0.name
49: k8s_irsa_name = "irsa-aws-secrets"
50: policy_arn = resource.aws_iam_policy.secrets_
policy.arn
51:
52: depends_on = [module.eks, resource.kubernetes_
namespace_v1.app]
53: }
XXXXXXXXXXXXXXX------SNIPPED-------XXXXXXXXXXXXXXXXXXXXX
Let’s dig into this module to understand better how the IAM Role is
being created.
Code Block 9-22. Implementing IRSA in Terraform
File: infra/modules/irsa/main.tf
02: data "aws_iam_policy_document" "default" {
03: statement {
04: actions = ["sts:AssumeRoleWithWebIdentity"]
05: effect = "Allow"
06:
07: condition {
08: test = "StringEquals"
09: variable = "${replace(var.oidc_url, "https://",
"")}:sub"
10: values = ["system:serviceaccount:${var.k8s_sa_
namespace}:${var.k8s_irsa_name}"]
11: }
12:
13: principals {
14: identifiers = [var.oidc_arn]
429
Chapter 9 SeCurity and SeCretS ManageMent
15: type = "Federated"
16: }
17: }
18: }
19:
20: resource "aws_iam_role" "default" {
21: name = var.k8s_irsa_name
22: path = "/"
23: assume_role_policy = data.aws_iam_policy_document.
default.json
24: }
25:
26: resource "aws_iam_role_policy_attachment" "default" {
27: role = aws_iam_role.default.name
28: policy_arn = var.policy_arn
29: }
L02–18: Defining the AssumeRole policy for the Web Identity Provider,
which is nothing but our OIDC URL. What this basically states is allow the
Kubernetes service account to Assume the web identity by authenticating
to the OIDC URL to access the AWS services whose permissions will be
attached later.
L20–24: Creating the IAM Role with a specific name and applying the
AssumeRole policy.
L26–29: The actual permissions that are allowed by the specific service
account and the IAM Role.
Finally, let’s look at the last piece of the puzzle that is the Kubernetes
service account creation and its attachment to the deployment pod.
430
Chapter 9 SeCurity and SeCretS ManageMent
Code Block 9-23. Creating a Kubernetes Service Account and
attaching in Kubernetes deployment
File: pgitops/infra/app.tf
55: resource "kubernetes_service_account" "irsa_aws_secrets" {
56: metadata {
57: name = module.irsa_aws_secrets.role_name
58: namespace = kubernetes_namespace_v1.app.metadata.0.name
59: annotations = {
60: "eks.amazonaws.com/role-arn" = module.irsa_aws_
secrets.role_arn
61: }
62: }
63: automount_service_account_token = true
64: depends_on = [module.eks,
resource.kubernetes_
namespace_v1.app]
65: }
099: resource "kubernetes_deployment_v1" "app" {
100: metadata {
101: name = var.org_name
102: namespace = kubernetes_namespace_v1.app.
metadata.0.name
XXXXXXXXXXXXXXX------SNIPPED-------XXXXXXXXXXXXXXXXXXXXX
197: service_account_name = resource.kubernetes_
service_account.irsa_aws_
secrets.metadata[0].name
198: }
L55–65: Defining the Kubernetes Service Account with the same name
as that of the IAM Role that it would be consuming and then deploying in
the same namespace as well.
431
Chapter 9 SeCurity and SeCretS ManageMent
L59–61: This is the key element here where we need to specify the ARN
of the IAM Role that would be assumed by this service account.
L197: The service account hence created must be passed to the
deployment pod so that it can read the token and authenticate to the OIDC
IdP and then access the AWS Secrets Manager.
Tip you are encouraged to execute the command kubectl get sa -n
gitops -o yaml to view the service accounts that are created and the
iaM role arn annotated.
9.8 Checkov Scanning
It is critically important that the code written by developers be scanned
for any security vulnerabilities. However, scanning on Terraform code is
a little bit different than the regular code scanning that is employed by
various tools as Terraform is a declarative language.
Another challenge is that since developers would be pushing changes
quite often, it would be nearly impossible for a single person to scan each
and every change manually.
Both these problems are addressed by this tool called Checkov, which
is a very popular and powerful tool to scan for security bad practices
in terraform code. Moreover, the authors of the tool have also created
a GitHub Action template, which helps in automated scanning of
each change.
The following code shows integration of Checkov into the GitHub
Action workflow configured for staging/production and global
environments. (Shown here is of only staging; however, the same is
applicable for global/production).
432
Chapter 9 SeCurity and SeCretS ManageMent
Code Block 9-24. Adding Checkov scanning in GitHub Actions
File: pgitops/.github/workflows/staging.yaml
XXXXXXXXXXXXXXX------SNIPPED-------XXXXXXXXXXXXXXXXXXXXX
46: - name: Run Checkov action
47: id: checkov
48: uses: bridgecrewio/checkov-action@master
49: if: github.event_name == 'pull_request'
50: with:
51: directory: global/
52: quiet: true
53: soft_fail: true
54: framework: terraform
55: output_format: cli
56: continue-on-error: true
L46–48: Declaring the Checkov GitHub Action name
L49: Executing the action only on Pull Requests.
L51: Defining the name of the folder on which the Checkov action
needs to be executed. It’ll scan all the *.tf files in the specified folder.
L52: Showing only failed results.
L53: A very important configuration. If set as true, it would fail the
GitHub Actions pipeline and stop the build/terraform execution.
The following code is used for showcasing the output of the Checkov
scan in PR messages.
Code Block 9-25. Spooling Checkov results in PR
File: .github/workflows/infra-staging.yaml
XXXXXXXXXXXXXXX------SNIPPED-------XXXXXXXXXXXXXXXXXXXXX
58: - name: Checkov Results
59: uses: actions/github-script@v6
433
Chapter 9 SeCurity and SeCretS ManageMent
60: if: github.event_name == 'pull_request'
61: env:
62: CHECKOV: "checkov\n${{ env.CHECKOV_RESULTS }}"
63: with:
64: github-token: ${{ secrets.GITHUB_TOKEN }}
65: script: |
66: const output = `## Checkov Results
67: <details><summary>Show Checkov Results</summary> 68: ${process.env.CHECKOV}
69: </details>
70: *Pusher: @${{ github.actor }}, Action: \`${{
github.event_name }}\`*`;
71: github.rest.issues.createComment ({
72: issue_number: context.issue.number,
73: owner: context.repo.owner,
74: repo: context.repo.repo,
75: body: output
76: })
XXXXXXXXXXXXXXX------SNIPPED-------XXXXXXXXXXXXXXXXXXXXX
9.8.1 Checkov in Action
Let’s execute the infra workflow to better understand how Checkov will
work as part of the GitHub Actions pipeline and observe the results.
To do this, we’ll need to first do some small modification to the code
and then create a branch. Then raise a PR into the staging branch to see
Checkov in action. We won’t actually run the code in staging as we only
need to see the PR running all the checks.
For this, I’ll modify the value of the instance_types from t3.medium to
t3.xlarge and t3.small to t3.large in the pgitops/infra/terraform.auto.tfvars
file as shown here.
434
Chapter 9 SeCurity and SeCretS ManageMent
Code Block 9-26. Testing Checkov
File: pgitops/infra/terraform.auto.tfvars
XXXXXXXXXXXXXXX------SNIPPED-------XXXXXXXXXXXXXXXXXXXXX
37: instance_types = ["t3.xlarge","t3.large"]
Let’s now create a feature branch and push the branch.
CLI Output 9-27. Starting Checkov action
cmd> git status
On branch main
Your branch is up to date with 'origin/main'.
Changes not staged for commit:
(use "git add <file>..." to update what will be committed)
(use "git restore <file>..." to discard changes in working directory)
modified: infra/terraform.auto.tfvars
no changes added to commit (use "git add" and/or "git
commit -a")
cmd> git checkout -b checkov
Switched to a new branch 'checkov'
cmd(checkov)> git add .
cmd(checkov)> git commit -m "modifying instance types"
[checkov 462cfcc] modifying instance types
1 file changed, 1 insertion(+), 1 deletion(-)
cmd(checkov)> git push origin checkov
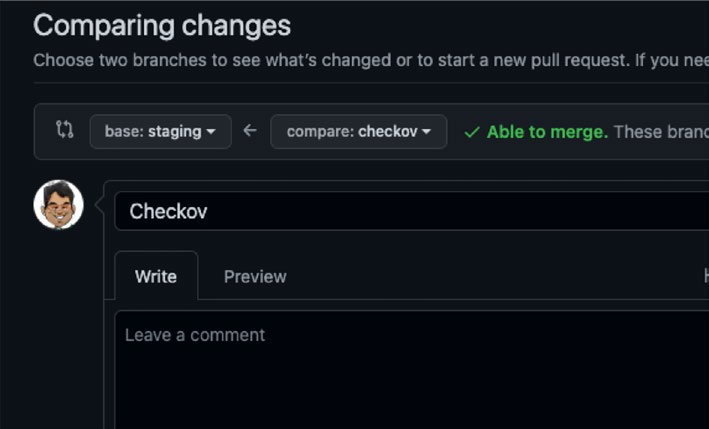
Next, let’s create a PR into staging as shown here.
435
Chapter 9 SeCurity and SeCretS ManageMent
Figure 9-6. PR for executing Checkov
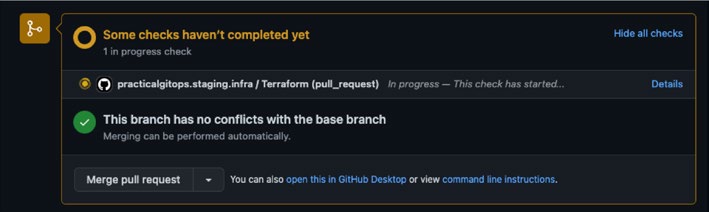
Once the PR is created, we can see that the workflow has been initiated
as shown here.
Figure 9-7. Checkov executed in PR
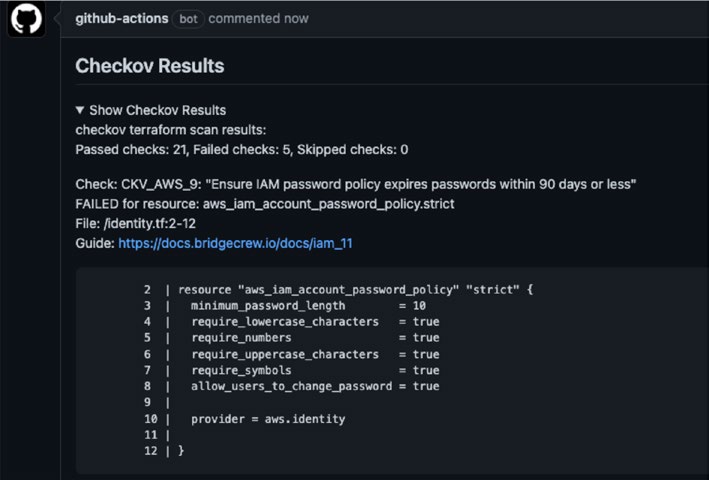
Once the action has completed its execution, we should be able to see
the Checkov results as shown here.
436
Chapter 9 SeCurity and SeCretS ManageMent
Figure 9-8. Checkov results being spooled
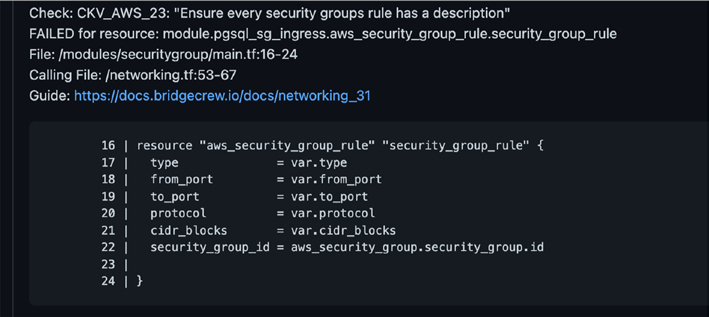
Another failed compliance is shown in the following.
Figure 9-9. Another failed compliance
437
Chapter 9 SeCurity and SeCretS ManageMent
In this manner, we can create guardrails around Terraform code that
our developers are pushing by reviewing them in PR messages.
Note i am not merging the pr here as i said earlier that we’ll be
working on the development environment only in this chapter and
the next.
9.9 Service Control Policies
AWS organizations do just help in centralizing billing and management of
all the child accounts/organization units but also can help in strategically
restraining certain actions at the account/OU level. Service Control
Policies (SCP) are policies that can be applied at the account/OU level to
restrict/control the usage of AWS resources.
For example, if we want to disallow users from spinning up EC2
instances like t3.xlarge, etc., that can consume a lot of money, then we can
enforce that at the account/OU level, which we’ll see as an example soon.
Hence, SCPs can help in enforcing compliance centrally through AWS
organizations. The following code is used to initialize the SCP using Terraform.
Code Block 9-28. Instantiating Service Control Policies
File: pgitops/global/organisations.tf
02: resource "aws_organizations_organization" "root" {
03:
04: enabled_policy_types = [
05: "SERVICE_CONTROL_POLICY",
06: "TAG_POLICY"
07: ]
08:
438
Chapter 9 SeCurity and SeCretS ManageMent
09: feature_set = "ALL"
10:
11: }
XXXXXXXXXXXXXXX------SNIPPED-------XXXXXXXXXXXXXXXXXXXXX
L04–07: Initializing Service Control Policy and Tag Policies at the AWS
Root organization.
SCP enforces resource-level compliance, whereas Tag Policy helps in
enforcing proper tags on resources.
I’ve written four different SCPs in the pgitios/global/scp.tf file. Let’s look at the InstanceTypeLimitSCP as shown here, which restricts the type of
instances that can be launched in staging and development environments.
Code Block 9-29. Creating the Instance Type SCP
File: pgitops/global/scp.tf
12: module "instance_type_limit_scp" {
13: source = "./modules/awsorgpolicy"
14:
15: policy_name = "InstanceTypeLimitSCP"
16: description = "Restrict EC2 and DB instance types for
dev/staging environments"
17: policy_file = "data/instance_type_limit.json"
18:
19: account_ids = [module.staging_account.id, aws_
organizations_organizational_unit.
development.id]
20:
21: depends_on = [resource.aws_organizations_
organization.root]
22:
23: }
XXXXXXXXXXXXXXX------SNIPPED-------XXXXXXXXXXXXXXXXXXXXX
439
Chapter 9 SeCurity and SeCretS ManageMent
L12–13: Defining and loading the module, which will create SCPs.
L15–16: Naming and describing the SCP. Describing the SCP is really
important as it helps to build context.
L17: The actual JSON policy document that will enforce the restriction.
It follows the standard IAM Policy document structure as we’ll see in
a while.
L19: Account/OU IDs on which this SCP needs to be applied to.
Let’s look at the actual policy that is codified for enforcing the EC2
instance types.
Code Block 9-30. The actual policy for restricting instance types
File: pgitops/global/data/instance_type_limit.json
01: {
02: "Version": "2012-10-17",
03: "Statement": [
04: {
05: "Sid": "LimitEC2Instances",
06: "Effect": "Deny",
07: "Action": [
08: "ec2:*"
09: ],
10: "Resource": "*",
11: "Condition": {
12: "ForAnyValue:StringNotLike": {
13: "ec2:InstanceType": [
14: "*.micro",
15: "*.medium",
16: "*.small",
17: "*.nano"
18: ]
19: }
440
Chapter 9 SeCurity and SeCretS ManageMent
20: }
21: },
XXXXXXXXXXXXXXX------SNIPPED-------XXXXXXXXXXXXXXXXXXXXX
39: ]
40: }
L01–03: Standard definition of an IAM Policy.
L04–09: Declaring the name of the policy and the effect and actions on
which the effect needs to be performed.
L10-18: Applying this to all resources that do not meet the condition of
the EC2 instance being of micro, medium, nano, or small type.
Hence, the policy states that “Deny any EC2 action if the instance
type doesn’t meet the criteria of being a micro, nano, small, or
medium.”
Similarly, three more policies have been defined as follows.
Table 9-1. All the SCPs configured
Policy Name
Accounts
Description
denyuserCreationSCp all except
deny Creation of users in all accounts except
identity
identity.
regionLockSCp
root account restrict aWS services and regions to
particular values, that is, “us-east-1” , “us-
east-2” , “us-west-1” , and “us-west-2” .
eBSrdSencryptionSCp production
enforce encryption on eBS block devices and
account
rdS storage for production account.
9.9.1 SCP in Action
Now that we know what SCP is, let's learn how it practically works.
441
Chapter 9 SeCurity and SeCretS ManageMent
Note Our SCps are already operational since we did the commit for
the global folder in the beginning of the chapter.
For this, we’ll first merge the changes between the Checkov branch
and the main branch since the PR request was not merged in the earlier
section.
CLI Output 9-31. Merging Checkov branch for testing the SCP
cmd(checkov)> git checkout main
Switched to branch 'main'
Your branch is up to date with 'origin/main'.
cmd> git merge checkov
Updating ffefeb3..6824a6b
Fast-forward
infra/terraform.auto.tfvars | 2 +-
1 file changed, 2 insertions(+), 2 deletions(-)
Next, just confirm that in the pgitops/infra/terraform.auto.tfvars file,
the instance_types is set to t3.large and t3.xlarge.
Now, as per our LimitEC2Instances SCP, the development
environment cannot have these instance types. Let’s test it out.
CLI Output 9-32. Testing the SCP
cmd> export AWS_PROFILE=sita-dev
cmd> cd infra
cmd> terraform init
cmd> terraform apply –auto-approve
Terraform would start its execution, and somewhere when it’s about
to create the EKS Node Groups, that is, the worker nodes, it will throw an
error looking something like the following.
442
Chapter 9 SeCurity and SeCretS ManageMent
CLI Output 9-33. Terraform fails to execute owing to InstanceType
limitation
⏐
│ Error: error creating EKS Node Group (gitops-us-east-1-dev:
app-20220707050520487800000019): InvalidRequestException: You are
not authorized to launch instances with this launch template.
Encoded authorization failure message: jkwlnVZ6DGXkSEoDoi2Qh21i
Dsrp4ZOLdVm0lOp1UqcrD3JtkrQmtSQoLirHj1pCgTxTA6hDvCahGWu-f73_gW2
TSBaBLLWV22cMCGyX0ef1mPyUSDE32dtJUD824WyFzVOXafE2UlaxM27_9purz
L0vmjP8qDOgQK88dOXXXXXXXXXXXXXXX------SNIPPED-------
XXXXXXXXXXXXXXXXXXXXXrHz6qM6MaGB8-B-1ZRSb8P3vPYuCKKuUQn8ImUP_
sezicOWKTvyoSW0XTRHjORPu7MS1gz2BQNROvnvvT8uLq9QfN504lO25d2nIuG
GI4GTrVRou0KpAoEWAJ8Z_ei_UP88I3J65fixRG0KHjeUHMMfkkh9JH1uQWHw9c
x1_Yfrvq1reTE4RHOAWafoTncVR-YCbv1CAkY-mdVF9drepeKOy7O0MSgkQUE4p
80w2p4MlII3CfmfMKUTvyXMAD0IlfSO6JhDWCx_qqHTI539PG-s67p1hAigvffMP
│ {
│ RespMetadata: {
│ StatusCode: 400,
│ RequestID: "a620ee2c-f788-45a9-857a-90de4b7f452d"
│ },
Let’s decode the message to better understand what’s happening. We’ll
need to make use of the following command:
aws sts decode-authorization-message --encoded-message
<encoded-message>
And apply little bit for formatting using sed 's/\\"/"/g' | sed 's/^"//' | sed
's/"$//'
as shown here.
443
Chapter 9 SeCurity and SeCretS ManageMent
CLI Output 9-34. Executing AWS STS decode-
authorization-message
cmd> aws sts decode-authorization-message --encoded-message
jkwlnVZ6DGXkSEoDoi2Qh21iDsrp4ZOLdVm0lOp1UqcrD3JtkrQmtSQoLirHj1p
CgTxTA6hDvCahGWu-f73_gW2TSBaBLLWV22cMCGyX0ef1mPyUSDE32dtJUD824
WyFzVOXafE2UlaxM27_9purzL0vmjP8qDOgQK88dOz7waPgIObTxOFYxLNak7U
LjfYQPtFzwzGN5SDpIg0cw_YwTgFZBXmcEA9tHXXXXXXXXXXXXXXX------
SNIPPED-------XXXXXXXXXXXXXXXXXXXXXQfN504lO25d2nIuGGI4GTrVRou0
KpAoEWAJ8Z_ei_UP88I3J65fixRG0KHjeUHMMfkkh9JH1uQWHw9cx1_Yfrvq1re
TE4RHOAWafoTncVR-YCbv1CAkY-mdVF9drepeKOy7O0MSgkQUE4p80w2p4MlII3
CfmfMKUTvyXMAD0IlfSO6JhDWCx_qqHTI539PG-s67p1hAigvffMP |
sed 's/\\"/"/g' | sed 's/^"//' | sed 's/"$//'
{
"DecodedMessage": "{"allowed":false,"explicitDeny":true,"ma tchedStatements":{"items":[{"statementId":"LimitEC2Instances","
effect":"DENY","principals":{"items":[{"value":"AROA5JNUXXXXXXX
XXXXXX"}]},"principalGroups":{"items":[]},"actions":{"items":[{
"value":"ec2:*"}]},"resources":{"items":[{"value":"*"}]},"
conditions":{"items":[{"key":"ec2:InstanceType","values":{"i tems":[{"value":"*.micro"},{"value":"*.medium"},{"value":"*.
small"},{"value":"*.nano"}]}}]}}]},"failures":{"items":[]},"c ontext":{"principal":{"id":"AROA5JNUXXXXXXXXXXXXX:aws-go-sdk-1657169654646371000","arn":"arn:aws:sts::91XXXXXXXX7:assumed-
role/AssumeRoleAdmindev/aws-go-sdk-1657169654646371000"},"act
ion":"ec2:RunInstances","resource":"arn:aws:ec2:us-east-1:91
XXXXXXXX7:instance/*","conditions":{"items":[{"key":"ec2:Metad ataHttpPutResponseHopLimit","values":{"items":[{"value":"2"}]}
},{"key":"ec2:InstanceMarketType","values":{"items":[{"value":
"on-demand"}]}},{"key":"aws:Resource","values":{"items":[{"val 444
Chapter 9 SeCurity and SeCretS ManageMent
ue":"instance/*"}]}},{"key":"aws:Account","values":{"items":[{
"value":"91XXXXXXXX7"}]}},{"key":"ec2:AvailabilityZone","value s":{"items":[{"value":"us-east-1c"}]}},{"key":"ec2:ebsOptimize d","values":{"items":[{"value":"true"}]}},{"key":"ec2:IsLaunch TemplateResource","values":{"items":[{"value":"true"}]}},{"ke y":"ec2:InstanceType","values":{"items":[{"value":"t3.large"}
]}},{"key":"ec2:RootDeviceType","values":{"items":[{"value":"
ebs"}]}},{"key":"aws:Region","values":{"items":[{"value":"us-east-1"}]}},{"key":"ec2:MetadataHttpEndpoint","values":{"items"
:[{"value":"enabled"}]}},{"key":"ec2:InstanceMetadataTags","val ues":{"items":[{"value":"disabled"}]}},{"key":"aws:Service","v alues":{"items":[{"value":"ec2"}]}},{"key":"ec2:InstanceID","v alues":{"items":[{"value":"*"}]}},{"key":"ec2:MetadataHttpToke ns","values":{"items":[{"value":"required"}]}},{"key":"aws:Type
","values":{"items":[{"value":"instance"}]}},{"key":"ec2:Tenanc y","values":{"items":[{"value":"default"}]}},{"key":"ec2:Region
","values":{"items":[{"value":"us-east-1"}]}},{"key":"aws:ARN",
"values":{"items":[{"value":"arn:aws:ec2:us-east-1:91XXXXXXXX7
:instance/*"}]}},{"key":"ec2:LaunchTemplate","values":{"items"
:[{"value":"arn:aws:ec2:us-east-1:91XXXXXXXX7:launch-template/
lt-007064a3db6d169af"}]}}]}}}
}
The preceding error message clearly mentions the SCP that blocked
the creation of our t3.large EC2 instance! It truly shows the power of policy
enforcement!
Of course, there is one drawback here: that this message is shown a
little later when almost half of the infrastructure is almost already set up.
445
Chapter 9 SeCurity and SeCretS ManageMent
9.10 Clean-Up
Since our infrastructure was only partially set up, it’s best to destroy it
using the usual terraform destroy command as shown here.
CLI Output 9-35. Destroying the Dev environment
cmd> export AWS_PROFILE=sita-dev
cmd> cd infra
cmd> terraform destroy -auto-approve
Note at any point, if terraform is unable to destroy, please check
annexure a where steps have been presented to delete the resources
manually.
We still are not destroying the global folder as it’s needed in the next
chapter.
Also we need to revert back the instance_type configuration for the
development environment, without which, we won’t be able to set up the
development environment. Let’s revert the values back to t3.small and
t3.medium as shown here.
Code Block 9-36. Reverting back the configuration
File: pgitops/infra/terraform.auto.tfvars
XXXXXXXXXXXXXXX------SNIPPED-------XXXXXXXXXXXXXXXXXXXXX
37: instance_types = ["t3.small","t3.medium"]
446
Chapter 9 SeCurity and SeCretS ManageMent
Once this configuration has been reverted, you are strongly advised to
run the terraform apply to set up the entire infrastructure and then check
the following:
–
Is HTTP being redirected to HTTPS?
–
Can you view the database credentials when viewing
the deployment manifests in Kubernetes? kubectl
describe deploy gitops -n gitops
–
Which service-account-token is mounted on gitops
deployment?
9.11 Conclusion
In this chapter, we saw how certain security features can be introduced
using Terraform to make our infrastructure a tidy bit more secure like
secrets being stored in AWS KMS and synced real time. Our website is
no longer serving on a clear-text port; rather, it is redirected to a secure
connection, that is HTTPS. We looked at how individual pods can securely
communicate with the AWS services using IRSA, implemented guardrails
with Checkov to better understand the security hygiene of our terraform
code, and finally enforced policy compliance centrally to ensure certain
best practices using SCPs.
In the next chapter, we’ll look at the logging, monitoring, and
observability aspects of this infrastructure that we’ve set up.
447
CHAPTER 10
Observability
Observability is the science of observing a running infrastructure through
various metrics and data points that the tools provide. While an entire
book can be written on how to actually observe your infrastructure, this
chapter's focus is more on how to set up the supporting infrastructure that
can help us drive decisions based on the behavior of the application that is
observable through various metrics and data points.
In this chapter, we’ll look at setting up an OpenSearch cluster to view
all Kubernetes and application logs in real time, observing performance
metrics using Prometheus and Grafana stack, centralizing CloudTrail of
all accounts into a single account, capturing ALB logs in an S3 bucket,
installing Karpenter (a horizontal node scaling tool to scale the nodes
based on pod requirements), upgrading the Kubernetes version from
1.20 to 1.21, and observing the changes happening in real time and finally
creating CloudWatch alerts based on events like root login.
10.1 Code Update
Before diving into the code, let’s first ensure that we’ve updated the pgitops
directory with the code from the Chapt folder. To do this, follow these steps:
– First, copy the contents of the Chaptto the pgitops folder.
– Get inside the pgitops directory and then check which
files/folders are changing.
© Rohit Salecha 2023
449
R. Salecha, Practical GitOps,
Chapter 10 Observability
– We shall commit only the global directory as we need the
changes to be reflected in the global environment.
– Changes done in the infra folder can be committed, and
the CI can be skipped as we’ll be testing the changes only
in the development environment for this chapter.
CLI Output 10-1. Updating Chapter code cmd> cp -a chapter10/. pgitops/
cmd> cd pgitops
cmd> git status
On branch main
Your branch is up to date with 'origin/main'.
Changes not staged for commit:
(use "git add <file>..." to update what will be committed)
(use "git restore <file>..." to discard changes in working
directory)
modified: README.md
modified: global/README.md
modified: global/data/padma.pub.old
modified: global/data/raadha.pub.old
modified: global/data/sita.pub.old
modified: global/identity.tf
modified: global/organisations.tf
modified: global/outputs.tf
modified: global/prod/main.tf
modified: global/staging/main.tf
modified: global/terraform.auto.tfvars.old
modified: global/variables.tf
modified: infra/README.md
modified: infra/app.tf
450
Chapter 10 Observability
modified: infra/eks.tf
modified: infra/modules/acm/main.tf
modified: infra/modules/alb/iam_policy.json
modified: infra/modules/alb/main.tf
modified: infra/modules/alb/variables.tf
modified: infra/modules/csisecretsdriver/aws-
secrets- csi.yaml
modified: infra/modules/ekscluster/main.tf
modified: infra/modules/ekscluster/output.tf
modified: infra/modules/vpc/main.tf
modified: infra/terraform.auto.tfvars.old
Untracked files:
(use "git add <file>..." to include in what will be
committed)
global/data/rds_encryption_check.json
global/logging.tf
global/logging/
global/modules/cwalarm/
global/modules/snsemail/
infra/modules/alb/s3_log.json
infra/modules/karpenter/
infra/modules/logging/
infra/modules/monitoring/
infra/observability.tf
no changes added to commit (use "git add" and/or "git
commit -a")
451
Chapter 10 Observability
The changes can summarized as follows:
– We are creating an Organization Trail that centralizes
CloudTrail from all accounts into the master account and
archiving it in an S3 bucket.
– Creating a CloudWatch rule that sends an email alert
whenever a root user logs into the accounts.
– Creating an Admin IAM Role in the master account and
allowing a Sita user to access the master account by
assuming this IAM Role.
– Creating an S3 bucket that stores all ALB access logs.
– Deploying Karpenter, a horizontal node scaler by AWS.
– Creating an OpenSearch cluster that will have application
and Kubernetes logs pushed into using Fluent bit.
– Creating a Monitoring stack using Prometheus and
Grafana, obtaining metrics using Metrics Server.
10.1.1 Committing Only Global
For the sake of simplicity and for ensuring that the global folder is
committed, let’s execute the following commands. However, there is a
small addition that needs to be done to the pgitops/global/terraform.auto.
tfvars file before pushing the code. There is an additional variable, alert_
email, that needs to be initialized without which our code will not run.
Ensure to add an appropriate value to it before pushing the code.
Code Block 10-2. Comitting only global changes
File: pgitops/global/terraform.auto.tfvars
XXXXXXXXXXXXXXX------SNIPPED-------XXXXXXXXXXXXXXXXXXXXX
452
Chapter 10 Observability
39: org_name = "gitops"
40: domain = "gitops.rohitsalecha.com"
41: alert_email = "[email protected]"
Of course, the ideal way to push this code would be to create a branch,
raise a PR, and then merge it. However, for sake of simplicity, let’s push it
directly into the main branch as shown here.
CLI Output 10-3. Pushing Global changes
cmd> git add .
cmd> git commit -m 'committing only global for chapter10
-- global
cmd> git push
Once we fire git push, it can be observed that only global changes have
gone live.
With these, the following items have been created:
– Organization Trail spooling all logs in CloudWatch of the
master account
– An S3 bucket archiving all CloudTrail data as backup
since CloudWatch has a limit of only 30 days of storage
– An IAM Role created in the master/root account for
Admin to access
– A CloudWatch Alarm with an SNS topic
10.1.2 Committing Infra
The other changes, for example, infra, etc., are still in staging in our local
system as shown in the following. Let’s push these changes as well but
without triggering the GitHub Actions, that is, by adding [skip ci] in our
commit message.
453
Chapter 10 Observability
CLI Output 10-4. Committing infra changes
cmd> git status
On branch main
Your branch is up to date with 'origin/main'.
Changes to be committed:
(use "git restore --staged <file>..." to unstage)
modified: README.md
XXXXXXXXXXXXXXX------SNIPPED-------XXXXXXXXXXXXXXXXXXXXX
modified: infra/modules/alb/s3_log.json
new file: infra/modules/karpenter/
modified: infra/variables.tf
cmd> git commit -m '[skip ci] committing infra'
cmd> git push
10.2 Executing Infra
Unlike the previous chapters, this time, let’s first start executing the infra in
the development environment to view all the different changes that we’ve
made as we progress through the code.
One small prerequisite for our infra code to run is an additional
variable alb_s3_bucket in the pgitops/infra/terraform.auto.tfvars file that needs to be instantiated as shown in the following. Please add an
appropriate value to this variable before executing the infra terraform files.
This variable holds the name of the S3 bucket, which will hold our ALB
Access Logs.
Code Block 10-5. Executing infra
File: pgitops/infra/terraform.auto.tfvars
454
Chapter 10 Observability
XXXXXXXXXXXXXXX------SNIPPED-------XXXXXXXXXXXXXXXXXXXXX
36: eks_version = "1.20"
37: instance_types = ["t3.medium","t3.small"]
38: alb_s3_bucket = "gitops-logs-s3-bucket-5"
Standard process now to execute our infra terraform files.
CLI Output 10-6. Executing infra changes in the dev environment
cmd> export AWS_PROFILE=sita-dev
cmd> cd pgitops/infra
cmd> terraform init
cmd> terraform apply --auto-approve
10.3 Organization Trail
AWS records all activities performed by a user/IAM Role through the
console as well as programmatically as events. These events are then
stored as records in a service called CloudTrail.
In order to get these records, CloudTrail needs to be enabled in all
accounts that are operational. When working with AWS organizations and
using various different accounts, it’s not feasible to go ahead and enable
CloudTrail in all accounts. Moreover, if you ever manage to do so, you’ll
always need to log into that account to view the CloudTrail logs under the
Logs section.
However, AWS in 2018 introduced a feature called Organization Trail,
which can be launched from the master account. Once enabled, this
feature enables CloudTrail in all existing accounts as well as new accounts
and most importantly gets all the CloudTrail logs from the member
accounts into the master account for central logging purpose.
455
Chapter 10 Observability
Let’s explore how this feature can be enabled through Terraform, and
in the Master Account Login section, we’ll actually log in and view the
CloudTrail records from other accounts.
Code Block 10-7. Enabling CloudTrail
File: pgitops\global\organisations.tf
2: resource "aws_organizations_organization" "root" {
3:
4: aws_service_access_principals = [
5: "cloudtrail.amazonaws.com"
6: ]
XXXXXXXXXXXXXXX------SNIPPED-------XXXXXXXXXXXXXXXXXXXXX
L4–6: When creating a service role in AWS IAM - that is, a role that
can be assumed by an AWS Service - you need to specify the service by a
unique identifier. That unique identifier is known as a service principal.
This service principal now allows access to CloudTrail service for all
accounts.
Tip Unofficial list of service Control principals
Code Block 10-8. Configuring Organization Trail
File: pgitops\global\logging.tf
XXXXXXXXXXXXXXX------SNIPPED-------XXXXXXXXXXXXXXXXXXXXX
10: resource "aws_cloudtrail" "central_cloud_trail" {
456
Chapter 10 Observability
11:
12: name = "CentralCloudTrail"
13: s3_bucket_name = module.logging.s3_bucket_id
14: s3_key_prefix = "trails"
15: enable_log_file_validation = true
16: enable_logging = true
17: include_global_service_events = true
18: is_multi_region_trail = true
19: is_organization_trail = true
20: cloud_watch_logs_role_arn = module.logging.cw_logs_
role_arn
21: cloud_watch_logs_group_arn = "${module.logging.cw_
logs_arn}:*"
22: depends_on = [module.logging,
23: aws_organizations_organization.root]
24: tags = {
25: terraform-managed = "true"
26: }
27: }
XXXXXXXXXXXXXXX------SNIPPED-------XXXXXXXXXXXXXXXXXXXXX
L10: This is the standard way of enabling a CloudTrail in AWS using
Terraform.
L13: This S3 bucket is created in the master account and is primarily
used for archiving.
L17–19: These are the actual flags that distinguish a local CloudTrail
from an Organization Trail. If set to true, the resource becomes an
Organization Trail enabling CloudTrail in all member accounts.
L20–21: Specification of the CloudWatch Group that is needed to view
the CloudTrail logs by default. This CloudWatch group is created in the
master account.
457
Chapter 10 Observability
Code Block 10-9. Adding logging configurations in the
master account
File: pgitops\global\logging.tf
2: module "logging" {
3: source = "./logging"
4: account = "master"
5: identity_account_id = module.identity_account.id
6:
7: }
XXXXXXXXXXXXXXX------SNIPPED-------XXXXXXXXXXXXXXXXXXXXX
In the preceding module, the following things are getting created in the
master account:
– CloudWatch Group for storing Organization Trail logs
– S3 bucket for Organization Trail with necessary IAM
Permissions such that CloudWatch can push the data
– IAM Admin Role for the master account
10.4 CloudWatch Alarm
In this section, we’ll look into how we’ve set up the CloudWatch Alarm for
root login by first creating a subscription using the AWS SNS and an alarm
on specific conditions using CloudWatch Alarm. Before we move on, let’s
first understand CloudWatch and SNS because this is one of the most
powerful combinations in AWS infrastructure as it helps in creating an
EDA (Event-Driven Architecture).
458
Chapter 10 Observability
CloudWatch keeps a track of all the events like bucket creation, new file
added to a bucket, EC2 creation, etc. You can attach a filter of your choice
to fish out the events that you are interested in like filter all events when an
EC2 is destroyed.
SNS can be used to send email or text notifications to end users. In
this case, you can trigger a notification based on an event that matches the
filter criteria that you have set inside CloudWatch; for example, if we create
a filter for the preceding use case that an EC2 is being destroyed, then it’ll
trigger an SNS notification, which in turn will trigger an SMS or an email to
the user.
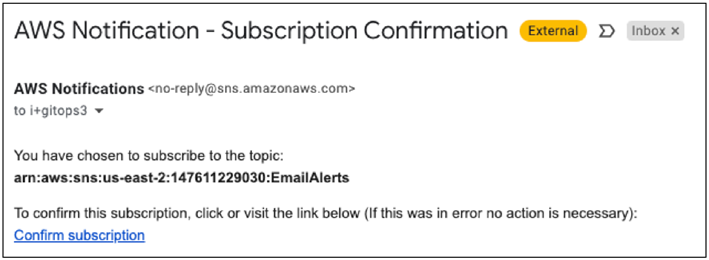
10.4.1 Configuring AWS SNS
Once the terraform code in the global folder is executed successfully, you
should receive an email on the value specified in the alert_email variable as shown here.
Figure 10-1. AWS SNS Subscription confirmation for Alert Email
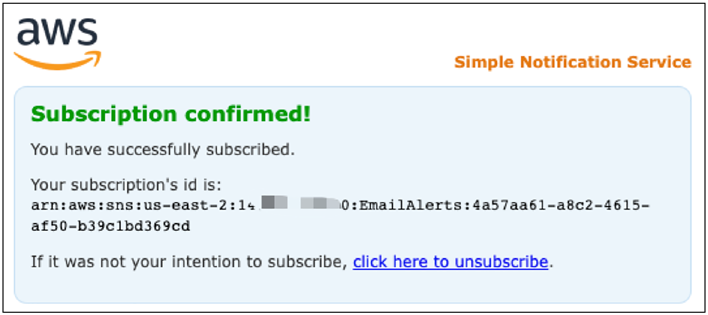
Warning ensure to click Confirm subscription to have the following
confirmation.
459
Chapter 10 Observability
Figure 10-2. Subscription confirmation
The following is the code that is responsible for doing the same. It
creates an AWS SNS (Simple Notification Service) subscription with the
email specified in the variable.
Code Block 10-10. Configuring SNS notification
File: pgitops\global\logging.tf
XXXXXXXXXXXXXXX------SNIPPED-------XXXXXXXXXXXXXXXXXXXXX
29: module "sns_alert" {
30: source = "./modules/snsemail"
31:
32: name = "EmailAlerts"
33: alert_email = var.alert_email
34:
35: }
460
Chapter 10 Observability
10.4.2 Configuring CloudWatch Alarm
Code Block 10-11. Configuring CloudWatch Alarm
File: pgitops\global\logging.tf
XXXXXXXXXXXXXXX------SNIPPED-------XXXXXXXXXXXXXXXXXXXXX
39: module "root_user_login_alarm" {
40: source = "./modules/cwalarm"
41: name = "RootLogin"
42: cw_group_name = module.logging.cw_log_
group_name
43: pattern = "{ ($.userIdentity.
type = \"Root\") &&
($.userIdentity.
invokedBy NOT EXISTS)
&& ($.eventType !=
\"AwsServiceEvent\") }"
44: metric_filter_count = "1"
45: metric_filter_namespace = "CloudTrailMetrics"
46: description = "A CloudWatch Alarm that
triggers if a root user
is logging in."
47: metric_alarm_statistic = "Sum"
48: metric_alarm_period = "60"
49: metric_alarm_threshold = "1"
50: metric_alarm_evaluation_periods = "1"
51: metric_alarm_comparison_operator = "GreaterThanOrEqualTo
Threshold"
52: metric_alarm_treat_missing_data = "notBreaching"
461
Chapter 10 Observability
53: sns_topic_arn = module.sns_alert.arn
54:
55: depends_on = [aws_cloudtrail.central_cloud_trail]
XXXXXXXXXXXXXXX------SNIPPED-------XXXXXXXXXXXXXXXXXXXXX
L39–41: Invoking the CloudWatch Alarm module and configuring the
name of this alarm as RootLogin.
L42: The CloudWatch group that will be monitored to raise the alarm,
basically the input to the alarm.
L43: Most important configuration, which is checking if the root user is
performing any AWS Activity, then please flag!
L47–51: Configuring the alarm to check for the CloudWatch data every
60 seconds for any breach.
L52: Configuring the default condition when there is no data.
L53: Configuring the SNS Topic created earlier where in case of a
breach or alarm being triggered, a notification will be sent to the AWS SNS
topic, and subsequently an email will be sent.
10.4.3 Root Login Alarm in Action
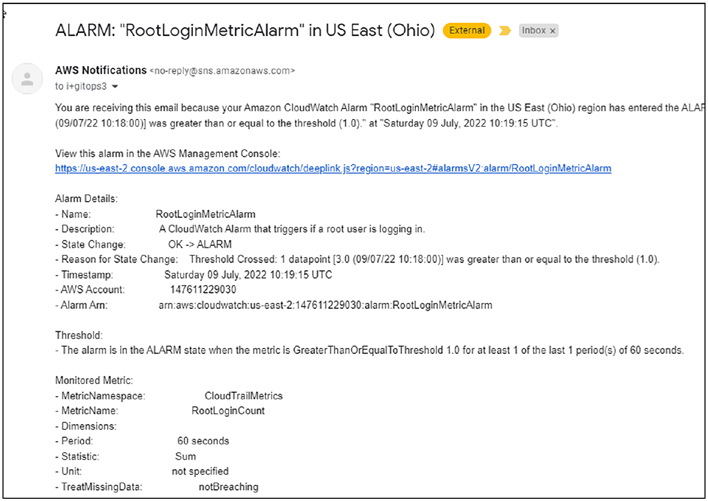
Let’s test this alarm by simply logging in using the root email address and
observing the email as shown in the following.
Note Wait for about two minutes after logging into the account to
get the email.
462
Chapter 10 Observability
Figure 10-3. Root Login Alarm in Action
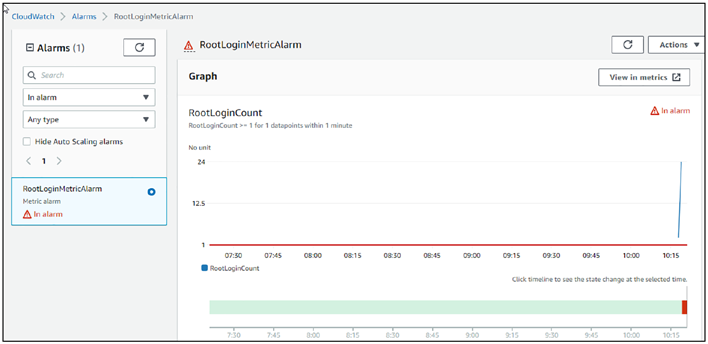
We can also see the Alarm being breached in the CloudWatch
console. Search for CloudWatch in the search bar and then open the
RootLoginCount Alarm as shown here.
463
Chapter 10 Observability
Figure 10-4. Root Login breach count
10.5 Master Account Login
So we created an Organization Trail in the master account, and the only
way to access the master/root account is to use the root credentials or the
credentials of the “gitops” admin user, which was the very first user that
we created. Both these credentials must be locked down and used only for
emergency purposes. Then how do we access the management account to
view the CloudTrail logs?
Very simple, create an IAM Role with administrator privileges and
then allow the Sita user to assume that role, which is what is being done as
shown in the following.
Note Of Course, you could use a lesser privilege role rather than an
administrator role like a simple Cloudtrailsadmin role as an example.
464
Chapter 10 Observability
Code Block 10-12. Updating Admin role privileges
File: pgitops\global\identity.tf
XXXXXXXXXXXXXXX------SNIPPED-------XXXXXXXXXXXXXXXXXXXXX
87: admin = [
88: module.staging.assume_admin_role_arn,
89: module.prod.assume_admin_role_arn,
90: module.dev.assume_admin_role_arn,
91: module.logging.assume_admin_role_arn
92: ],
XXXXXXXXXXXXXXX------SNIPPED-------XXXXXXXXXXXXXXXXXXXXX
Earlier we logged into the master account using the root credentials;
let’s login into the master account now using this newly created IAM Role
assumed by user Sita.
1. Firstly, we need the account ID of the master
account in order to log in; hence, from the CLI, fire
the following commands.
CLI Output 10-13. Login using GitOps user credentials
cmd> export AWS_PROFILE=gitops
cmd> aws sts get-caller-identity
{
"UserId": "AIDASEXSQTNTGAEZIZL3P",
"Account": "14XXXXXXX30",
"Arn": "arn:aws:iam::14XXXXXXX30:user/gitops"
}
Make a note of this account ID.
465
Chapter 10 Observability
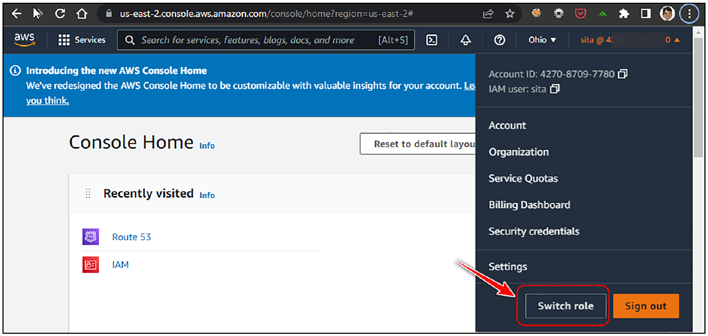
2. Let’s log in into the console of the identity account
using the Sita user’s credentials and click Switch role
as shown here.
Figure 10-5. Switch role through Console
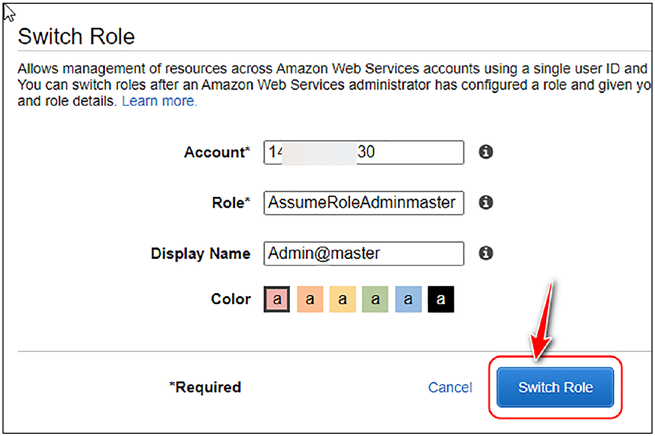
3. Now in the Switch role console, enter the Account
ID obtained earlier and name of the IAM Role,
which can be obtained from the Terraform Cloud
Global workspace outputs as shown here.
466
Chapter 10 Observability
Figure 10-6. Switch Role details
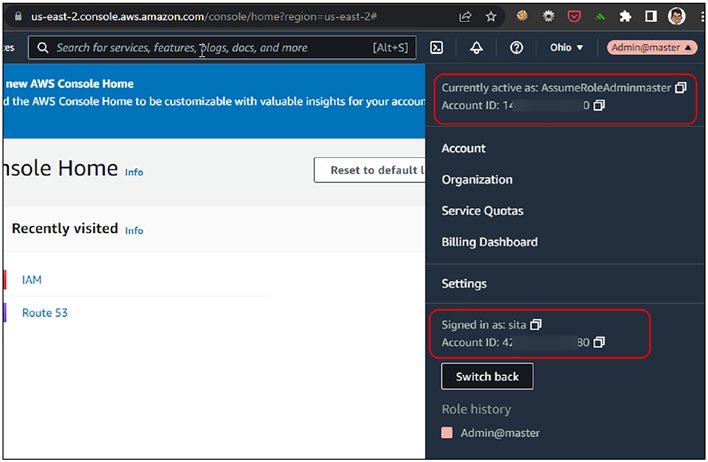
4. If everything is correctly entered, you should be
navigated to the master account as shown here.
467
Chapter 10 Observability
Figure 10-7. Switched Role to master account
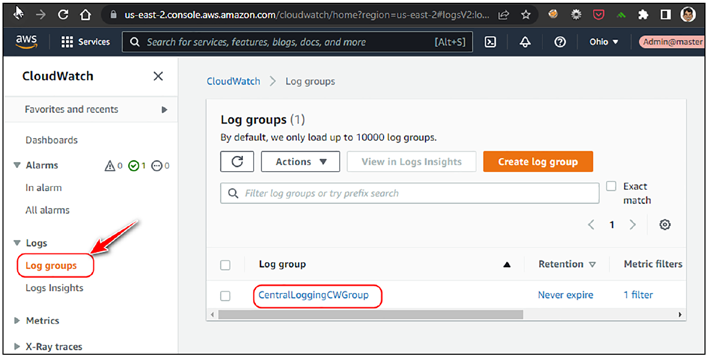
5. Navigate to the CloudWatch Console and view the
CloudTrail group as shown in the following. Ensure
you are in the correct region, that is, (us-east-2).
468
Chapter 10 Observability
Figure 10-8. Navigating to the CloudWatch console
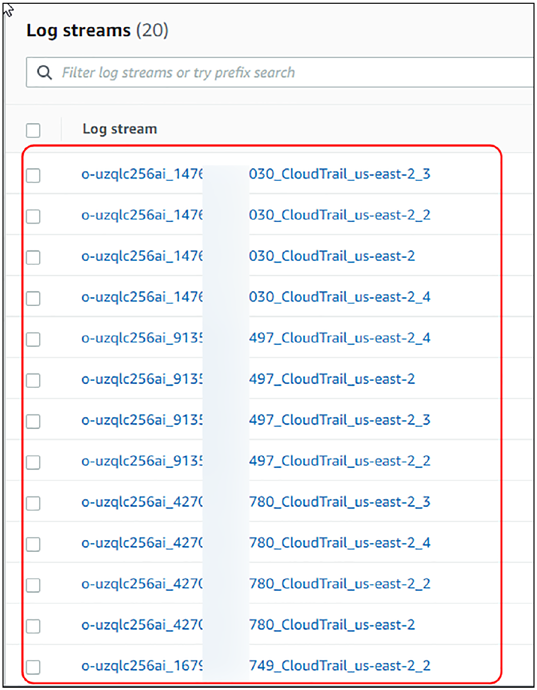
6. Streams from different accounts can be seen.
469
Chapter 10 Observability
Figure 10-9. Streams from different accounts
10.6 ALB Access Logs
The load balancer is the first point of entry into our application, and hence,
access logs need to be maintained and stored as per many compliance
frameworks. These logs can help in identifying any unusual activity or
debug an issue.
470
Chapter 10 Observability
Also, setting this up is relatively easy; we only have to set up an S3 bucket
and reference the bucket in an annotation of the ingress resource as shown here.
Code Block 10-14. Updating Kubernetes ingress resource for
ALB Logging
File: pgitops\infra\app.tf
229: resource "kubernetes_ingress_v1" "app" {
230: wait_for_load_balancer = true
231: metadata {
232: name = var.org_name
233: namespace = kubernetes_namespace_v1.app.
metadata.0.name
234: annotations = {
235: "kubernetes.io/ingress.
class" = "alb"
XXXXXXXXXXXXXXX------SNIPPED-------XXXXXXXXXXXXXXXXXXXXX
241: "alb.ingress.kubernetes.io/load-balancer-attributes"
= "access_logs.s3.enabled=true,access_logs.
s3.bucket=${var.alb_s3_bucket},access_logs.
s3.prefix=gitops,routing.http.drop_invalid_header_
fields.enabled=true"
242: "alb.ingress.kubernetes.io/group.name"
= "gitops"
L241: An additional annotation that has been added, “alb.ingress.
kubernetes.io/load-balancer-attributes”, which holds the name of the S3
bucket and its prefix where the logs will be stored.
L242: Another annotation that has been added to group ingress rules
within the same resource. As we’ll see in Section 10.8, when we set up
Grafana, this same annotation will be added to Grafana’s ingress resource.
471
Chapter 10 Observability
Thereby we avoid setting up two different AWS ALBs, which is the default
behavior as discussed in Section 7.6.
10.7 Logging
Setting up a logging infrastructure is extremely important as any
debugging if needed has to be done by sifting through the logs we have.
Logging infrastructure gives us feedback of what’s really happening, what
data is coming in, and how the application is processing the data.
The EFK or the Elastic, Fluent Bit, and Kibana is one of the most
popular stacks for setting up the logging infrastructure. AWS has set up
its own stack called OpenSearch, which was forked out of Elastic Stack v
7.10 onward.
It is an onerous and a mammoth task to set up a logging infrastructure
because of the two most important factors that need to be considered,
namely, scalability and security.
A logging infrastructure needs to be scalable as application usage
can go up during certain periods and down during certain ones. Hence, a
standard production-grade EFK stack will have multi-node clusters.
It also has to maintain top-notch security because plenty of sensitive
information like credit card numbers, passwords, etc., that would be
part of HTTP requests/responses could be stored/processed in this
infrastructure.
AWS through OpenSearch provides both scalability and security;
hence, it’s prudent to use this service.
The entire logging infrastructure setup has been encapsulated in a
single module in Terraform as shown in the following.
Code Block 10-15. Creating the OpenSearch Stack
File: pgitops\infra\observability.tf
472
Chapter 10 Observability
06: module "logging" {
07: source = "./modules/logging"
08:
09: es_instance_type = "t3.medium.elasticsearch"
10: es_instance_count = 1
11: es_version = "OpenSearch_1.2"
12: fb_version = "2.23.3"
13: oidc_url = module.eks.cluster_oidc_issuer_url
14: oidc_arn = module.eks.oidc_provider_arn
15: acm_arn = module.acm.acm_arn
16: url = local.url
17: zone_id = data.aws_route53_zone.
domain.zone_id
18: environment = var.environment
19: fluentbit_count_yaml = length(data.kubectl_file_
documents.fluentbit_yaml_count.
documents)
20:
21: depends_on = [
22: module.eks,
23: resource.kubectl_manifest.aws_auth
24: ]
25: }
L09–11: Important prerequisites that need to be provided to set up
the OpenSearch cluster. It has its own instance naming convention like
t3.medium.elasticsearch. Cluster count is important, and for production
purposes, this should be a minimum of 3.
L12–14: Providing information to set up Fluent Bit, which is a tool
that ships the logs to the OpenSearch cluster. It’ll run as a DaemonSet on
each node, and an IRSA (hence sharing OIDC information) setup has to be
made so that it can write to the OpenSearch cluster.
473
Chapter 10 Observability
L15–17: The OpenSearch corresponds to Elasticsearch, and for Kibana,
we have OpenDashboard provided by AWS, and it can be accessible over
the Internet. Hence, providing it the requisite information to set up on a
customer domain taking the format as logging.<environment>.<domain>.
For example, for the development environment, it’ll be accessible on
the FQDN as logging.dev.gitops.rohitsalecha.com where gitops.
rohitsalecha.com is the main domain and dev is the environment.
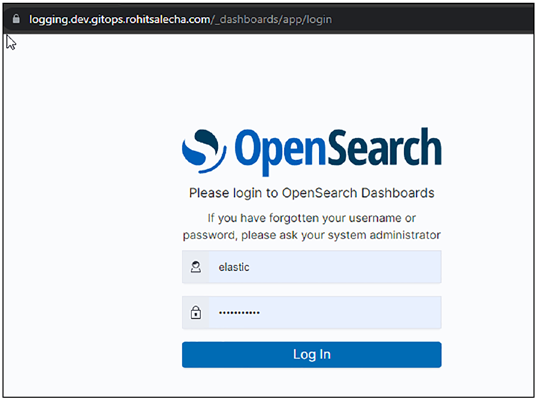
10.7.1 Exploring OpenSearch
The full URL for accessing our OpenSearch cluster in the dev environment
is as follows:
and the credentials are elastic:Elastic@123, which are currently
hard-coded in pgitops\infra\modules\logging\main.tf, and it is strongly
recommended that they are changed and also make use of a secrets
managing service to store them.
Figure 10-10. Login Console of OpenSearch
474
Chapter 10 Observability
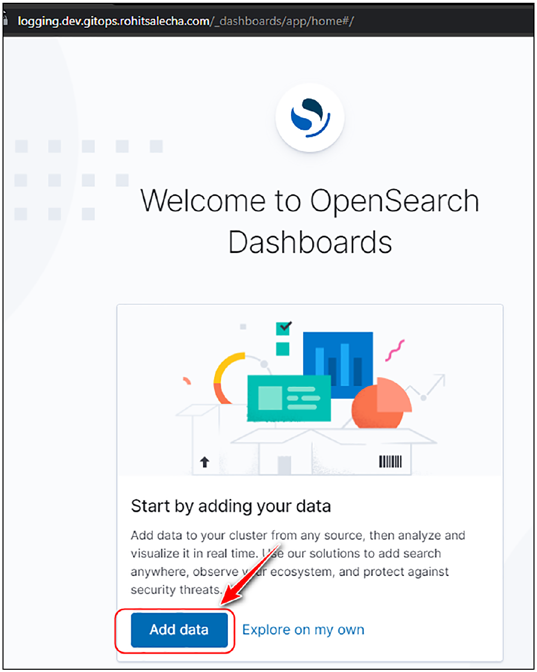
Post authentication, two options are provided; select “Add data” as
shown here.
Figure 10-11. Add data after login
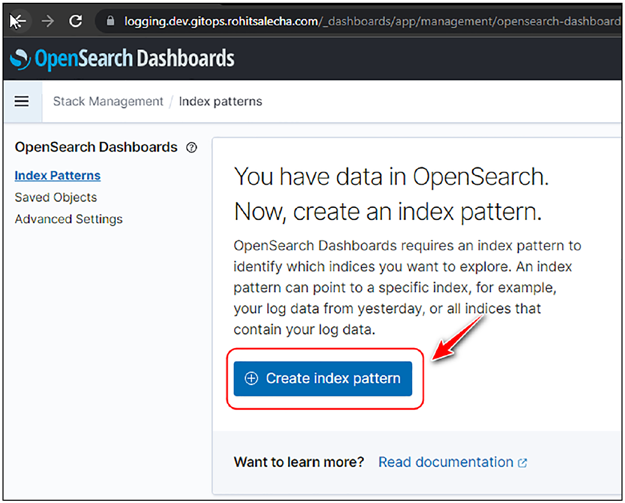
Next, we need to create an Index in the OpenSearch cluster as
shown here.
475
Chapter 10 Observability
Figure 10-12. Create Index Pattern
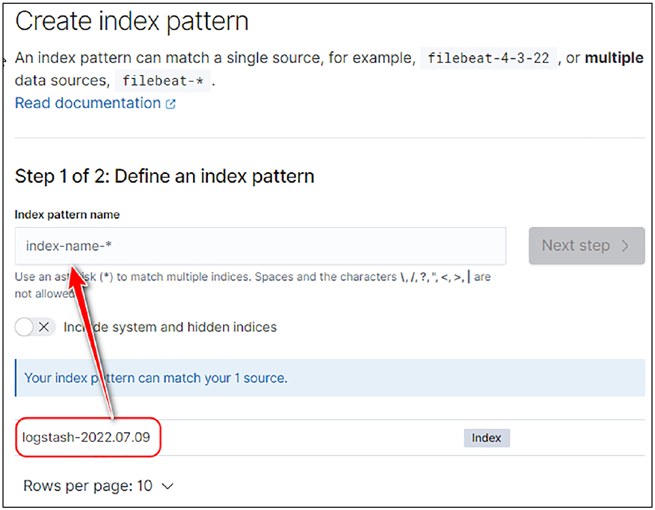
By default, the index name logstash-<date> will show up, which needs
to be copied and pasted in the Index pattern name field as shown in the
following. Then click Next step.
476
Chapter 10 Observability
Figure 10-13. Add logstash pattern
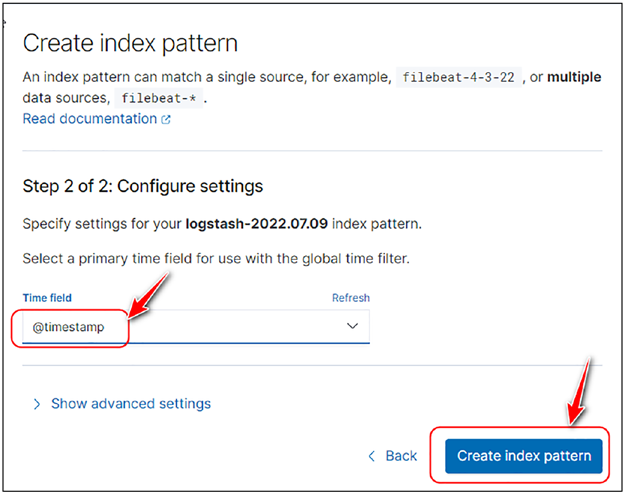
Select timestamp and then click “Create index pattern” as shown here.
477
Chapter 10 Observability
Figure 10-14. Selecting timestamp
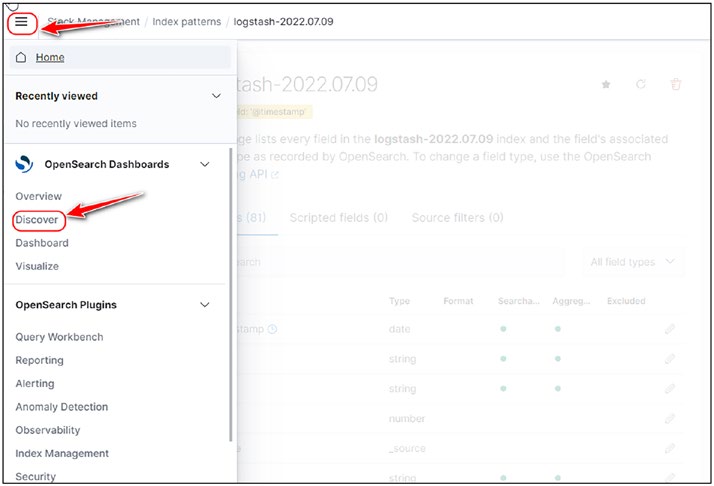
Once the index pattern is created, click on the hamburger menu and
then click Discover.
478
Chapter 10 Observability
Figure 10-15. Navigating to the Discover page
In this page, we can now see all our Application as well as Kubernetes
logs as shown in the following pictures.
479
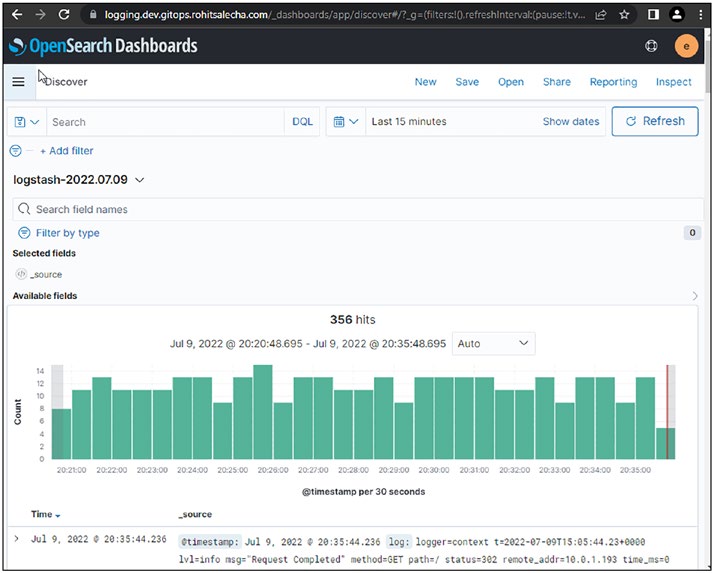
Chapter 10 Observability
Figure 10-16. Application as well as Kubernetes logs
Kubernetes logs can be seen by default.
480
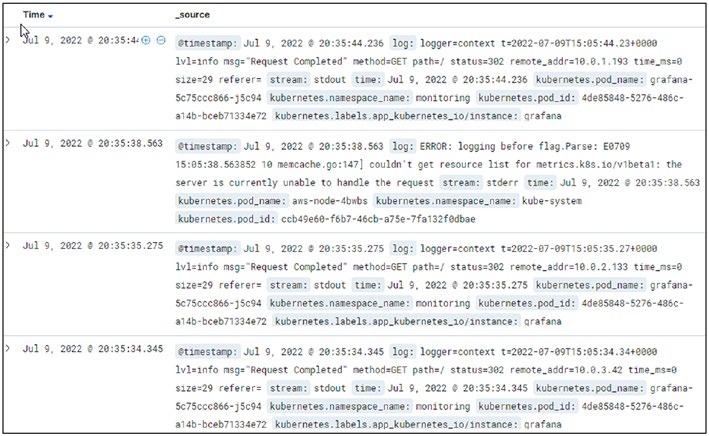
Chapter 10 Observability
Figure 10-17. Kubernetes logs
To see the application logs, visit the application and then create a user
with testata as shown in the following.
Click Add User.
481
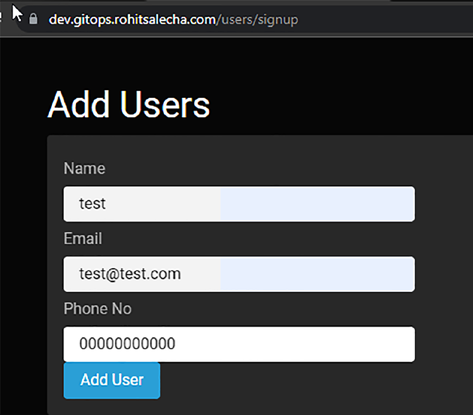
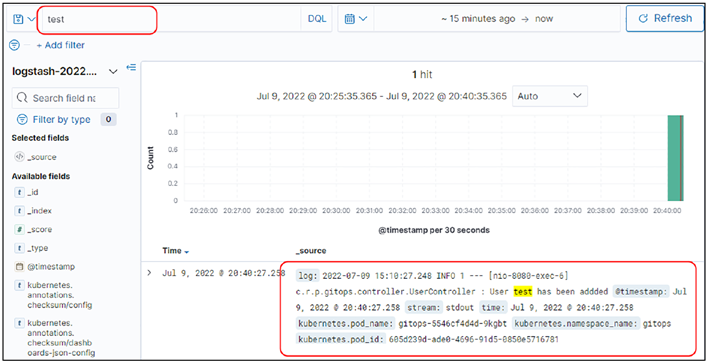
Chapter 10 Observability
Figure 10-18. Adding test data
Now go back to the OpenDashboard Discover page, and in the query
box, search for “test” as shown in the following, and we can see our
application logs being shown.
Figure 10-19. Viewing test data in the OpenSearch console
482
Chapter 10 Observability
Thus, this sets up our logging infrastructure where we can view all our
logs in a single place.
10.8 Monitoring
Monitoring our infrastructure is very critical especially when we are
having so many moving parts like pods, ingresses, nodes, etc. How do we
know how many pods are running or how many nodes are currently there
without actually accessing the Kubernetes API?
Kubernetes dashboard provides a one-stop solution for logging as well
as monitoring; however, Prometheus and Grafana stack are one of the
most popular as they can be used to monitor not just Kubernetes but also
EC2 instances and many more types of infrastructure that Prometheus
supports.
Hence, the monitoring infrastructure in this book has been set up
using Prometheus, Grafana, and the default metrics server provided by
Kubernetes. Installation of this entire stack has been encapsulated in the
following module:
483
Chapter 10 Observability
&ŝůĞ͗ŝŶĨƌĂͰŽďƐĞƌǀĂďŝůŝƚLJ͘ƞ
Ϯϴ͗ŵŽĚƵůĞΗŵŽŶŝƚŽƌŝŶŐΗ
Ϯϵ͗ƐŽƵƌĐĞсΗͬ͘ŵŽĚƵůĞƐͬŵŽŶŝƚŽƌŝŶŐΗ
ϯϬ͗
ϯϭ͗ŐƌĂĨĂŶĂͺǀĞƌƐŝŽŶсΗϲ͘Ϯϲ͘ϬΗ
ϯϮ͗ƉƌŽŵĞƚŚĞƵƐͺǀĞƌƐŝŽŶсΗϭϱ͘ϴ͘ϬΗ
ϯϯ͗ŵƐͺǀĞƌƐŝŽŶсΗϯ͘ϴ͘ϬΗ
ϯϰ͗ĂĐŵͺĂƌŶсŵŽĚƵůĞ͘ĂĐŵ͘ĂĐŵͺĂƌŶ
ϯϱ͗ƵƌůсůŽĐĂů͘Ƶƌů
ϯϲ͗njŽŶĞͺŝĚсĚĂƚĂ͘ĂǁƐͺƌŽƵƚĞϱϯͺnjŽŶĞ͘ĚŽŵĂŝŶ͘njŽŶĞͺŝĚ
ϯϳ͗
ϯϴ͗ĚĞƉĞŶĚƐͺŽŶс
ϯϵ͗ŵŽĚƵůĞ͘ĞŬƐ͕
ϰϬ͗ƌĞƐŽƵƌĐĞ͘ŬƵďĞĐƚůͺŵĂŶŝĨĞƐƚ͘ĂǁƐͺĂƵƚŚ
ϰϭ͗
ϰϮ͗
Figure 10-20. Setting up monitoring using Prometheus, Grafana,
and Metrics Server
L31–33: Grafana, Prometheus, and Metrics Server are being set up using
Helm charts, and their specific versions have been provided here. All three are
being set up on our Kubernetes Nodes and Grafana exposed to the Internet.
L34–36: These details are needed to expose Grafana over to the
Internet as monitoring.<environment>.<domain-name>. For example, for
our case, it would be monitoring.dev.gitops.rohitsalecha.com.
10.8.1 Exploring Grafana
Let’s access our Grafana application located a
Credentials are grafana:Gr@fAna123, hard-coded in
pgitops\infra\modules\monitoring\main.tf.
484
Chapter 10 Observability
Figure 10-21. Logging into Grafana
It is strongly recommended to change these credentials and also
implement a Secrets Management strategy as discussed in Chapting AWS Secrets Manager.
Post authentication, the default screen of Grafana can be seen. Since
no dashboard has been set up, let’s import one by clicking Import as
shown here.
485
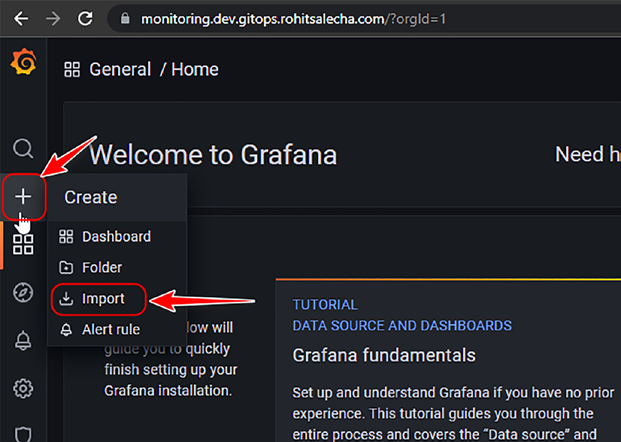
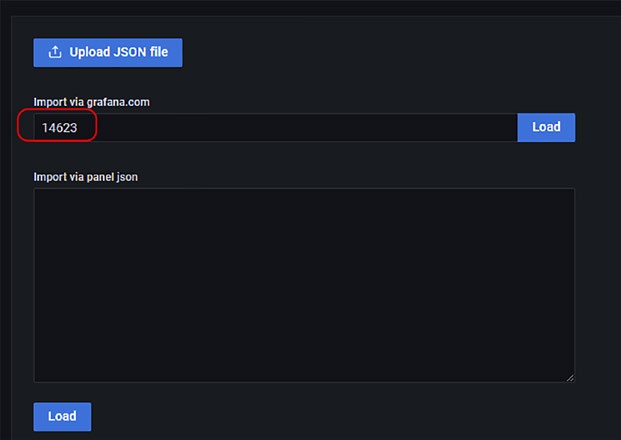
Chapter 10 Observability
Figure 10-22. Importing a Grafana dashboard
Enter the ID 14623 as shown in the following and click Load.
Figure 10-23. Enter the ID 14623
486
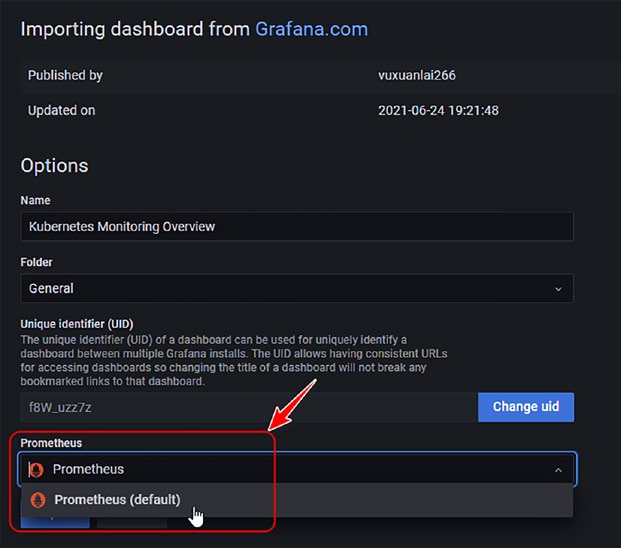
Chapter 10 Observability
Select the Datasource as Prometheus, leaving everything else as
default. Then click Import.
Figure 10-24. Selecting Prometheus as the default data source
And our super cool Grafana dashboard is ready for monitoring almost
all metrics: CPU usage, RAM usage, number of pods, number of nodes, etc.
487
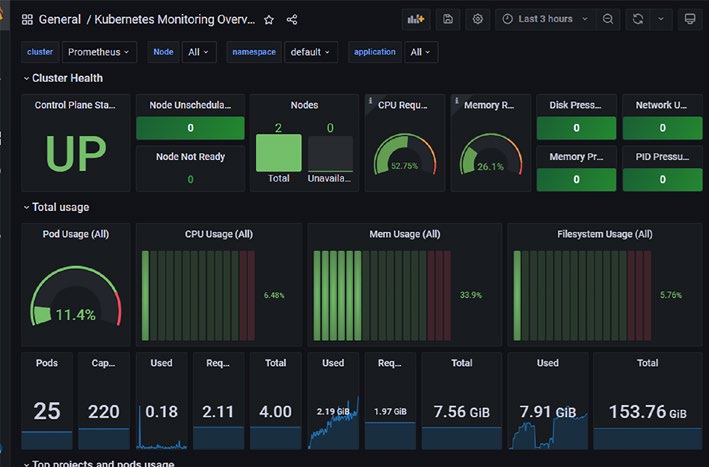
Chapter 10 Observability
Figure 10-25. Grafana dashboard showing all monitoring metrics
10.9 Karpenter Autoscaler
One of the biggest advantages of using Kubernetes is the ability to scale
based on various factors. We can scale up pods based on the incoming
network traffic and also scale up nodes to accommodate the rising number
of pods. The former is also called vertical scaling, and the latter is called
horizontal scaling.
This chapter will discuss horizontal scaling, that is, scaling nodes
based on the increasing/decreasing number of pods.
For AWS EKS, AWS has an open source project called Karpenter that
can be installed using Helm charts, and the entire configuration has been
encapsulated in a module as shown here.
488
Chapter 10 Observability
Code Block 10-16. Installing Karpenter
File: pgitops\infra\eks.tf
58: module "karpenter" {
59: source = "./modules/karpenter"
60:
61: node_group_role_arn = module.eks.eks_managed_node_
groups["app"].iam_role_name
62: eks_cluster_id = module.eks.cluster_id
63: eks_cluster_endpoint_url = module.eks.cluster_endpoint
64: oidc_url = module.eks.cluster_oidc_
issuer_url
65: oidc_arn = module.eks.oidc_provider_arn
66: karpenter_version = "v0.6.0"
67:
68: depends_on = [module.eks, module.networking]
69: }
L61: The EKS module creates a role that has permissions to create/
delete EC2 nodes, and that Role name is being passed on to Karpenter so
that it can also get the same permissions to create EC2 instances and join
them into the EKS cluster.
L62–66: Details about the cluster are needed so that Karpenter can
join the correct cluster.
10.9.1 Karpenter in Action
Let’s view Karpenter in action. As per the Grafana dashboard we saw
earlier, only two nodes were configured. Let’s now increase the number
of deployment replicas from 1 to 10 as shown below and then perform
terraform apply.
489
Chapter 10 Observability
Code Block 10-17. Updating deployments to view Karpenter
in action
File: pgitops\infra\app.tf
099: resource "kubernetes_deployment_v1" "app" {
100: metadata {
101: name = var.org_name
102: namespace = kubernetes_namespace_v1.app.
metadata.0.name
103: labels = {
104: app = var.org_name
105: }
106: }
107:
108: spec {
109: replicas = 10
XXXXXXXXXXXXXXX------SNIPPED-------XXXXXXXXXXXXXXXXXXXXX
L109: Add a zero.
Let’s run terraform apply and observe the nodes and metrics in
Grafana.
CLI Output 10-18. Executing changes of ten deployments
cmd> export AWS_PROFILE=sita-dev
cmd> cd pgitops/infra
cmd> terraform apply --auto-approve
Before Apply
490
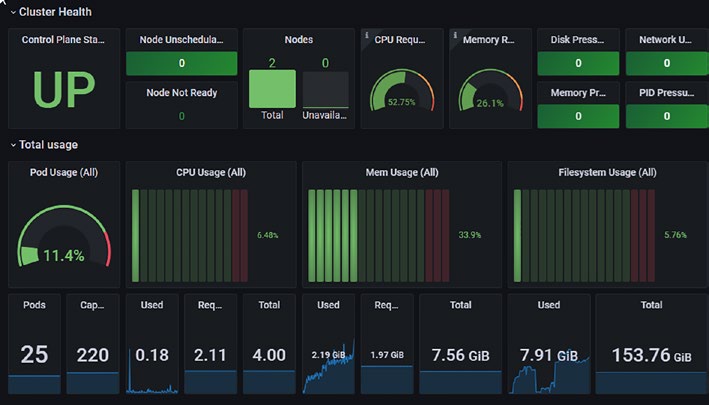
Chapter 10 Observability
Figure 10-26. Before applying the changes
After Apply
Ten minutes after applying the changes, CPU usage is high, the
number of nodes is 3, and the number of pods shots up to 40!
491
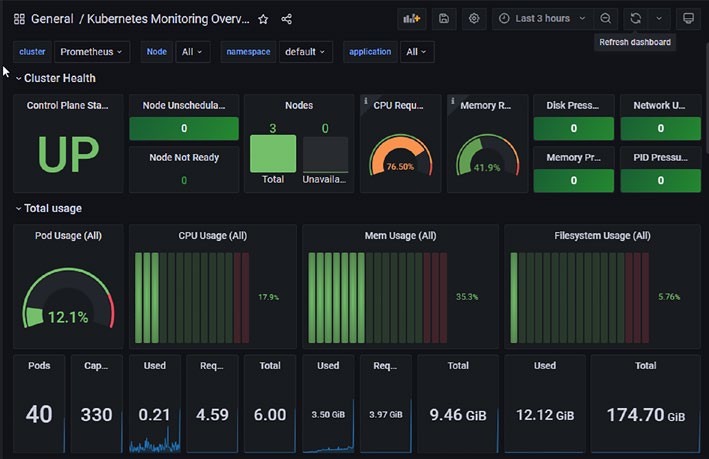
Chapter 10 Observability
Figure 10-27. After applying changes
Let’s view the change from the console.
CLI Output 10-19. Viewing changes from the console
cmd> aws eks update-kubeconfig --name gitops-us-east-1-dev
--region us-east-1
cmd> kubectl get nodes -o wide
Output shows three nodes; however, if carefully observed, the runtimes
of the three nodes are different as shown here.
492
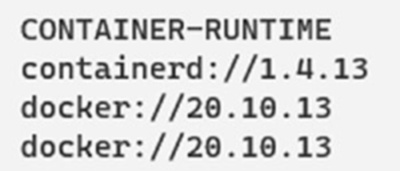
Chapter 10 Observability
CLI Output 10-20. Three nodes are up, one by Karpenter
That is because when Karpenter launches a node, it builds it with the
default runtime as containerd://1.4.13
Hence, setting up the nodes with Karpenter is an easy task; however,
if the infrastructure was to be destroyed at this stage, Terraform would
error out as it doesn’t have the capability to delete a node set up using
Karpenter. This is a known issue captured here:
Hence, if a Karpenter launched node needs to be deleted, then an
instance with the name “karpenter.sh/provisioner-name/default” needs to
be searched in the EC2 home page and manually deleted.
To avoid such a scenario, let’s revert back the setting from ten replicas
to one and apply terraform apply.
CLI Output 10-21. Reverting the changes
cmd> export AWS_PROFILE=sita-dev
cmd> cd pgitops/infra
cmd> terraform apply --auto-approve
The Grafana dashboard should now show the reduced numbers as it
was earlier once terraform apply is completed.
10.10 Upgrading Kubernetes
Upgrading Kubernetes infrastructure is challenging for any administrator.
However, with AWS EKS and Terraform, it is quite simple where we only
need to modify the version (and also ensure that the deployment resources
493

Chapter 10 Observability
are compatible with that version) in the pgitops\infra\terraform.auto.tfvars
from 1.20 to 1.21 and then perform terraform apply!
Code Block 10-22. Upgrading to version 1.21
File: pgitops\infra\terraform.auto.tfvars
36: eks_version = "1.21"
CLI Output 10-23. Executing the change
cmd> export AWS_PROFILE=sita-dev
cmd> cd pgitops/infra
cmd> terraform apply --auto-approve
XXXXXXXXXXXXXXX------SNIPPED-------XXXXXXXXXXXXXXXXXXXXX
Plan: 0 to add, 20 to change, 0 to destroy
The apply operation will take approximately 40–45 minutes as the
following actions will be undertaken:
1. AWS Master node will be upgraded which is totally
abstracted from us which would take about 10
minutes as shown below. New TLS certificates being
generated shows a new cluster has been created.
CLI Output 10-24. New cluster being created
494

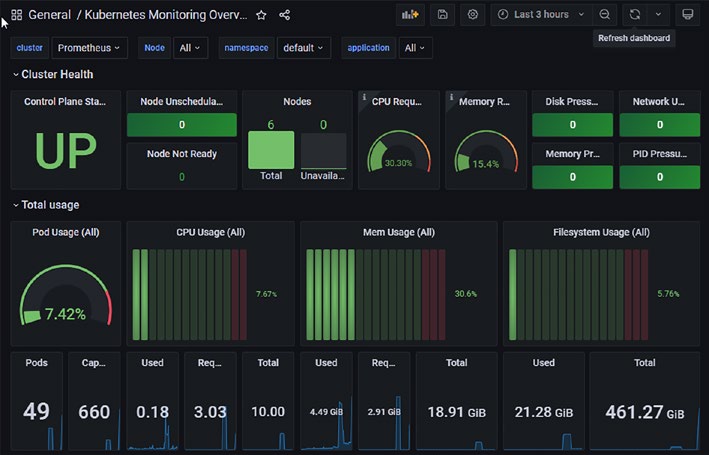
Chapter 10 Observability
2. New nodes with the new version will be created first.
CLI Output 10-25. New nodes being created
The Grafana dashboard at this point shows six nodes.
Figure 10-28. Grafana dashboard showing six nodes
3. Once new nodes are created, pods from the old
nodes will be cordoned off and consequently will
be installed in new nodes. At this point, Grafana
will sign you out, and you’ll need to re-log in and
re-import the dashboard. Once done, it should show
around nine nodes as shown here.
495
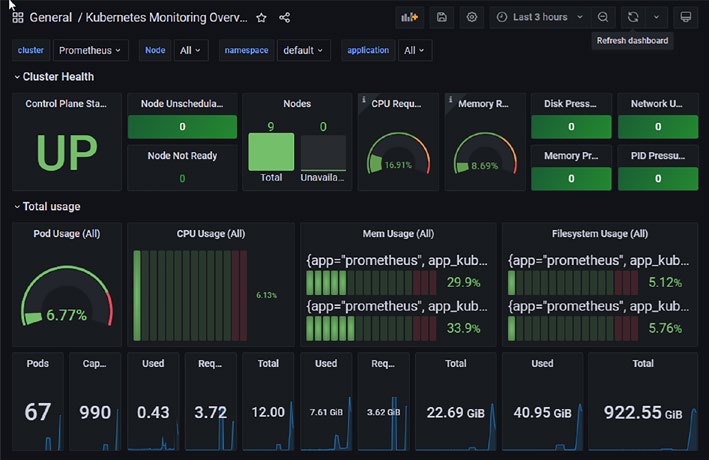
Chapter 10 Observability
Figure 10-29. Grafana dashboard showing nine nodes
4. Old nodes will be destroyed/unscheduled once
the pods are cordoned off. The following Grafana
dashboard shows one node is unschedulable,
meaning old nodes are now being destroyed.
496
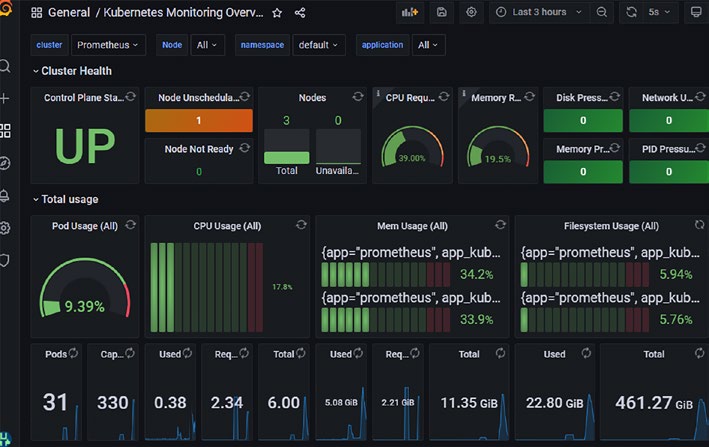
Chapter 10 Observability
Figure 10-30. One node is unschedulable
5. Finally, the entire cluster will fall back to normalcy
with 2 nodes and 25 pods as shown here.
497
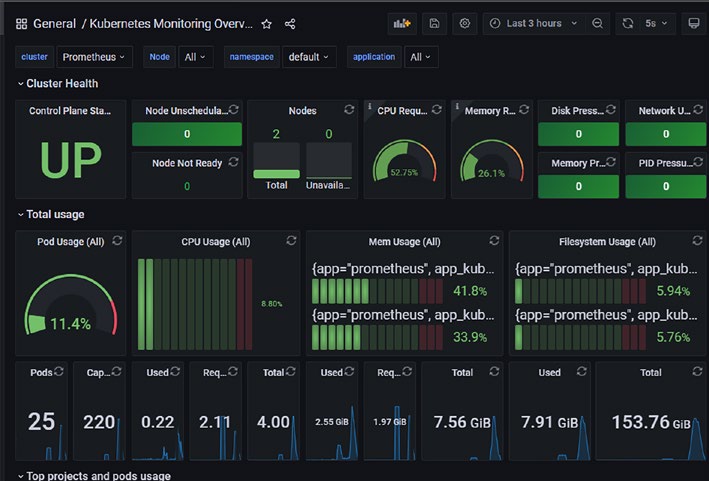

Chapter 10 Observability
Figure 10-31. Cluster back to normal
In this entire process, the application never goes down! It’s always up.
Kubernetes has now been upgraded to 1.21 as shown here!
Figure 10-32. New cluster is up
10.11 Clean-Up
While cleaning the infra folder is quite easy and straightforward as in
this chapter, only the development environment was set up. So a simple
terraform destroy would do the work as shown here.
498
Chapter 10 Observability
CLI Output 10-26. Destroying the environment
cmd> export AWS_PROFILE=sita-dev
cmd> cd pgitops/infra
cmd> terraform destroy--auto-approve
Note at any point, if terraform is unable to destroy, please check
annexure a where steps have been presented to delete the resources
manually.
However, cleaning up the global folder is a bit challenging as there are
plenty of dependencies involved. These steps are totally optional, and the
only cost that is being incurred if the global folder is not destroyed is the
three Route53 Zones that have been set up. The rest is all nonchargeable.
The very first thing that needs to be done is that each user needs to
first delete their access keys by manually logging into the AWS console and
then deactivating and deleting the keys.
However, for us since Sita is the IAMAdmin in the Identity account we
can login into the account and delete the keys of all users.
Once the access keys have been deleted, browse to the Global
workspace of the Terraform Cloud application and destroy the plan as
shown here.
499
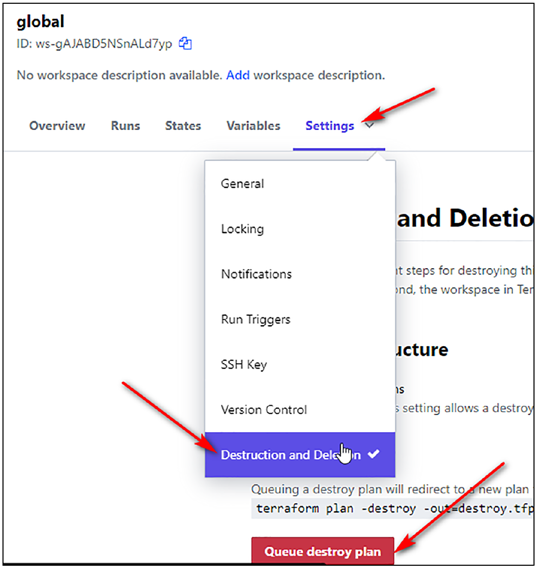
Chapter 10 Observability
Figure 10-33. Destroy Global in Terraform Cloud
Terraform destroy will run effectively and destroy all the resources
except the AWS accounts and will show the following error.
500
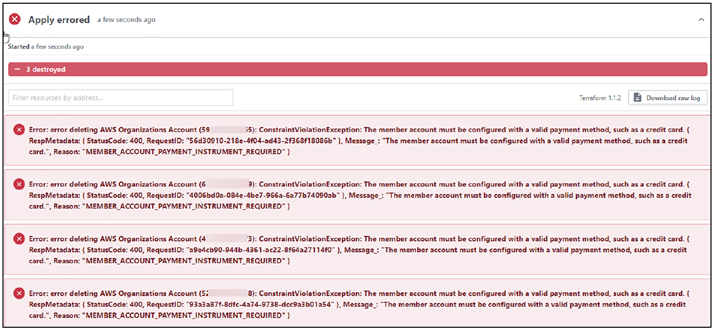
Chapter 10 Observability
Figure 10-34. Terraform account deletion error
AWS accounts cannot be deleted using Terraform, and hence, the only
way to delete them is to follow these steps:
– Reset the password of the root user for each of the pre-
ceding accounts using the forgot password functionality.
Please set a strong password and enable 2FA if possible.
– You can now close your account by simply navigating to
the Accounts section here:
. Scroll down and click Close Account.
501
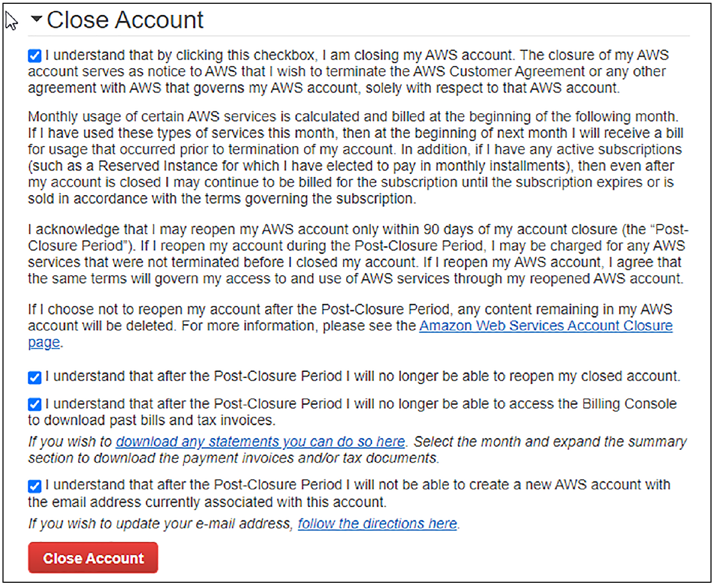
Chapter 10 Observability
Figure 10-35. Closing the AWS account
Once the account is closed, you can no longer use the email address
associated with the closed account to create a new account.
Tip if you ever plan to re-run the terraform code in the global folder,
ensure to use new email addresses like instead of
, .
Also do remove the NS mapping in your hosted zone records that were
created in Chapter
502
Chapter 10 Observability
10.12 Conclusion
This concludes the chapter and this book where we saw how cloud and
cloud-native resources can be spun up and teared down with the power
of Infrastructure as Code all the while with full automation and guardrails
in place.
I hope by reading this book, the reader can get a better understanding
and insight into Terraform, AWS, and GitHub Actions, the three main
pillars of discussion throughout this book, and how all of them can be
tied together to bring forth a completely automated system that is version
controlled in Git, making it practical GitOps. :-)
503
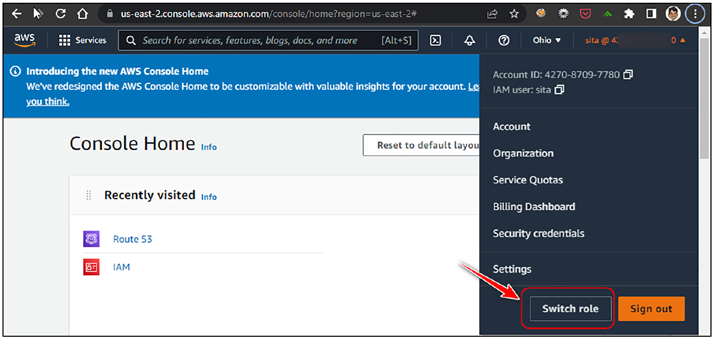
ANNEXURE A
Manually Delete
Resources
In order to delete resources from a specific account, first, we need to as-
sume a role into that account, namely, prod, staging, and dev, where the
resources are stuck.
The same can be done by logging into the identity account and then
clicking Switch role as shown here.
Assume the role by entering the requisite information. All the
information is available in the Global workspace of the Terraform cloud
application.
© Rohit Salecha 2023
505
R. Salecha, Practical GitOps,
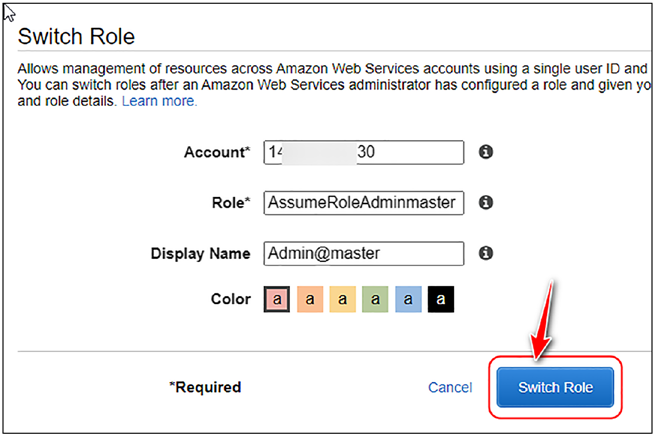
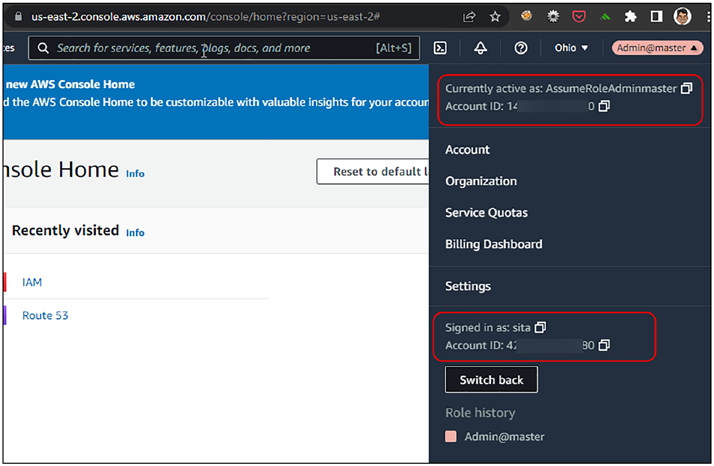
Annexure A MAnuAlly Delete resources
Now navigate through the following links to destroy the specific
resources.
506
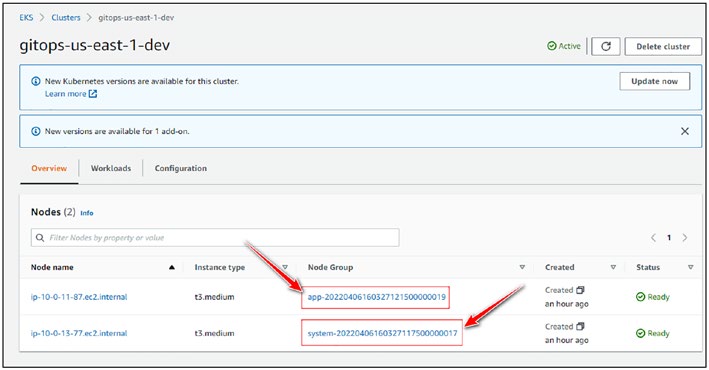
Annexure A MAnuAlly Delete resources
Ensure that the resources are destroyed in this specific order. Also ensure you are in the correct region.
1) Delete RDS –
2) Delete RDS Subnet Group –
3) Delete SSM Parameter –
4) Delete EKS – Click on the EKS Cluster configured:
a) Delete NodeGroups – Click on each Node Group as
shown here.
b) Delete the App NodeGroup.
507
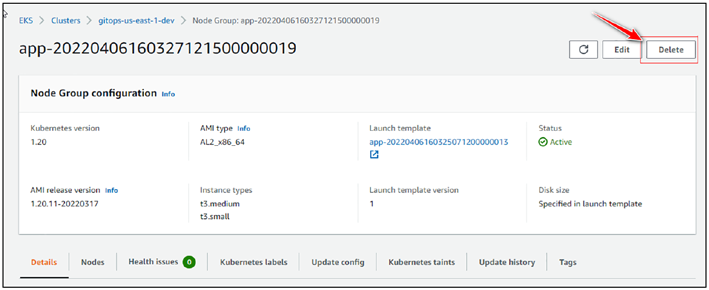
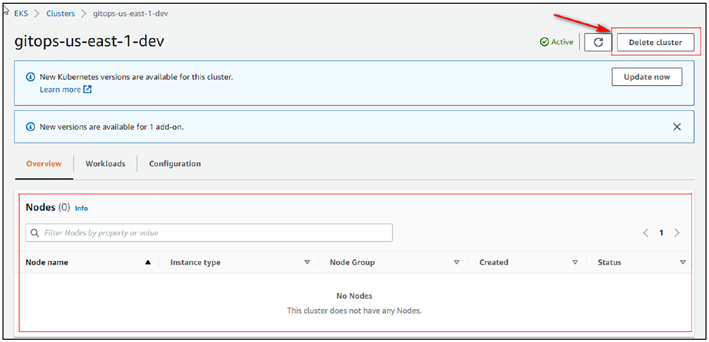
Annexure A MAnuAlly Delete resources
c) Navigate back. Select the System NodeGroup and then delete
the System NodeGroup.
d) Wait for about five minutes and then delete the EKS Cluster as
shown in the following once the NodeGroup is shown empty.
5) Delete the OpenSearch Cluster –
508
Annexure A MAnuAlly Delete resources
6) Disable and delete KMS keys – All KMS keys with
alias as “eks” need to be first disabled and then
delete
7) Delete Identity Provider –
8) Delete LB –
9) Delete ACM Certificates –
10) Delete Secret from Secrets Manager –
11) Delete CloudWatch Log Groups (All) –
12) Detach VPC Gateways – First, select the VP Gateway
and then detach it. Once detached, delete it:
13) Delete NAT Gateway –
509
Annexure A MAnuAlly Delete resources
14) Release Elastic IPs – (Wait for NAT Gateway to
be deleted before tryin
15) Delete any residual Network Interfaces(if any) –
16) Delete the VP
17) Delete Customer-Created Policies – AWSLoadBa
lancerControllerIAMPolicy1,secrets_policy and
AmazonEKS_EFS_CSI_Driver_Policy
18) Delete the following IAM Roles – app-
eks-node-group-2*************** ,
aws-load-balancer-controller,gitops-
us-east-1-dev-cluster-2*************,system-eks-
node-group-20*****************,irsa-aws-secrets,efs-
csi-controller-sa
510
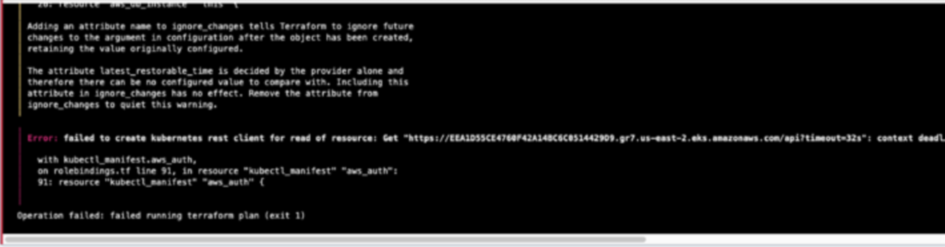
ANNEXURE B
Terraform Cloud
Destroy Problem
While destroying the staging/production environment from the Terra-
form Cloud, you may encounter an error like as follows.
In this scenario, we need to download the state file from the terraform
cloud, add it in the location where the source code for the development
environment is located, modify the variables, and then run terraform
destroy as shown in the following.
1. Download the state file.
© Rohit Salecha 2023
511
R. Salecha, Practical GitOps,
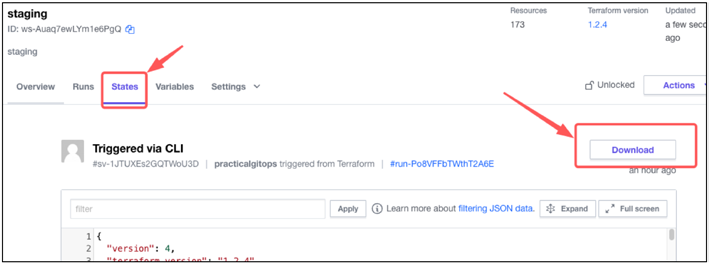
Annexure B terrAforM clouD Destroy ProBleM
2. Move the state file to the code location.
cmd> ls -al
total 4064
-rw-r--r--@ 1 rohit rohit 974819 Jul 8 18:45
sv-1JTUXEs2GQTWoU3D.tfstate
cmd> mv sv-1JTUXEs2GQTWoU3D.tfstate terraform.tfstate
cmd> mv terraform.tfstate pgitops/infra
3. Update the default variables to reflect the staging/
prod environment.
File: pgitops/infra/variables.tf
4: variable "environment" {
5: description = "The Deployment environment"
6: type = string
7: default = "staging"
8: }
9:
15: variable "region" {
16: description = "AWS region"
17: type = string
18: default = "us-east-1"
19: }
512
Annexure B terrAforM clouD Destroy ProBleM
4. Update the account of the staging/prod
environment that needs to be destroyed.
File: infra/terraform.auto.tfvars
43: assume_role_account_id = "16XXXXXXXXX9"
5. Finally, run terraform destroy.
cmd> export AWS_PROFILE=sita-staging
cmd> terraform destroy --auto-approve
513
ANNEXURE C
Code Compatibility
on OS
C.1 Mac M1
All chapters have been thoroughly tested, and code is working fine
on Mac M1.
C.2 Windows Native (cmd.exe)
Code works absolutely fine on all chapters except for Chapt
In Chapt, I am making use of a local-exec as shown in the following where curl needs to be used. This local-exec is not working on Windows
even after installing curl on the Windows path. Hence, Chapt
doesn’t work on Windows native.
File: pgitops\infra\modules\logging\main.tf
156: resource "null_resource" "fluentbit-role" {
157: provisioner "local-exec" {
158: command = <<EOT
159: curl -sS -u "${local.es_username}:${local.es_
password}" -X PATCH \
© Rohit Salecha 2023
515
R. Salecha, Practical GitOps,
Annexure c coDe coMPAtiBility on os
160: https://${aws_elasticsearch_domain.es.endpoint}/_
opendistro/_security/api/rolesmapping/all_
access?pretty \
161: -H 'Content-Type: application/json' \
162: -d'
163: [
164: {
165: "op": "add", "path": "/backend_roles",
"value": ["'${aws_iam_role.irsa_
fluentbit.arn}'"]
166: }
167: ]
168: '
169: EOT
170: }
171: triggers = {
172: endpoint = aws_elasticsearch_domain.es.endpoint
173: }
174:
175: depends_on = [resource.aws_elasticsearch_domain.es]
176: }
C.3 WSL2 (Ubuntu)
Tested the code on WSL2 for all chapters and it works absolutely fine till
Chaptowever, from Chapt onward, you might get this error:
│ Error: Kubernetes cluster unreachable: Get "https://
B29481B1D200A05798E568DCF979DE62.gr7.us-east-1.eks.amazonaws.
com/version": getting credentials: decoding stdout: no
kind "ExecCredential" is registered for version "client.
516
Annexure c coDe coMPAtiBility on os
authentication.k8s.io/v1alpha1" in scheme "pkg/runtime/
scheme.go:100"
│
│ with module.alb_ingress.helm_release.lbc,
│ on modules/alb/main.tf line 73, in resource "helm_
release" "lbc":
│ 73: resource "helm_release" "lbc" {
To resolve this error on WSL (Ubuntu), modify
api_version = “client.authentication.k8s.io/v1beta1” to v1alpha1 as shown below
provider "helm" {
kubernetes {
host = module.eks.cluster_endpoint
cluster_ca_certificate = base64decode(module.eks.cluster_
certificate_authority_data)
exec {
api_version = "client.authentication.k8s.io/v1alpha1"
command = "aws"
args = [
"eks",
"get-token",
"--role-arn",
local.assume_role_arn,
"--cluster-name",
module.eks.cluster_id
]
}
}
}
This issue has been reported (
517
Index
A, B
production environment, 240
profiles, 385–387
Amazon Web Services (AWS), 1
Route53 Zone, 355–357
access control, 390–393
scalability, 32
account creation
secrets management
access keys screen, 37
design, 414–424
cost explorer, 35
email address, 33
security/secrets management,
final screen, 37
397, 408–418
IAM dashboard, 34
Spring Boot app, 263
policy/permissions screen, 36
terraform, 68
user screen, 35
Application Load Balancer (ALB)
authentication/authorization
access logs, 470–472
(authz), 372–385
security/secrets
cloud computing, 33
management, 408–410
documentation, 31
Application programming
EC2 machine, 40
interface (API)
Elastic Compute Cloud, 33
actions tab, 213
historical overview, 32
driven terraform workspace,
identity and access
210, 211
management
environment variables, 211, 212
(IAM), 338–355
pushing workflow, 212
infrastructure resources, 32
workflow execution
login information
apply stage, 215–217
access keys file, 38
configuration, 213
CLI profile configuration, 39
execution, 215
sign-in screen, 39
logs streaming, 218
organization trail, 455
trigger, 214
organization units, 326–338
triggering workflow, 214
© Rohit Salecha 2023
519
R. Salecha, Practical GitOps,
INDEX
Application programming
auth ConfigMap, 380
language (API)
client authentication, 374,
driven workspace, 232
375, 377, 379
Authentication/authorization
ConfigMap creation, 376
(authz), 323
cross-account role
access control, 390–393
access, 383
AWS profiles, 385–387
development
clean-up process, 393
environment, 384
dev environment, 393
MySQL/PostgreSQL, 373
staging/prod environments,
node authentication,
394, 395
379–382
code update, 324–326
prod and staging
credential file, 385
environments, 384
development environment, 387
provider
global execution
configuration, 382–385
account IDs, 368
RoleBinding code, 378
apply process, 364–367
pgitops directory, 324
email information, 371
prod environment, 389, 390
GNU PG keys, 358–360
requirements, 323
links, 368
staging workspace, 388, 389
name servers, 369
Automation
output process, 368
cloud application
PR screen request, 366
authorization, 176, 177
resources, 357
connection, 176
subscription, 372
creation, 175
terraform cloud workspace,
execution plan, 184
363, 364
GitHub repository, 178
users block, 370
limitation, 194
variable
queue destroy plan, 193
configuration, 360–363
repositories, 178, 179
IAM roles for service
version control
accounts, 424–432
workflow, 175
infrastructure, 385–390
driven workspaces, 179–182
Kubernetes specifications
EC2 status, 219
520
INDEX
environment variables, 183
automation, 175–178
execution plan
backend.tf file, 142
accessing public IP, 187
cleanup commands
apply completed, 186
confirmation screen, 165
confirm/apply terraform
deletion, 164
plan, 186
destroy, 161
manual trigger, 184
destruction and
plan output, 185
deletion, 163
GitHub repository
EC2 console, 161
creation, 172
workspaces, 162–165
HTTPS URL, 173
CLI output, 151
source code, 173
configuration file, 142, 143
SSH URL, 173
destroy command, 151
steps, 171
dev.hcl file, 142
init/plan/apply commands, 171
directory structure, 140
manual trigger, 187–191
multi-environment (DRY),
prerequisites, 170
156–160
queue destroy plan, 218–220
operations, 127, 128
plan output, 145
C
prerequisite, 124
requirements, 126
Checkov scanning
running terraform plan, 143, 144
action, 434, 435
runs/states tab
definition, 432
configurations, 154
execution process, 436
diff, 154, 155
GitHub actions, 433
log command, 152, 153
PR messages, 438
states log, 153
results, 436, 437
states tab, 153
security vulnerabilities, 432
security plan, 165, 166
spooling results, 433
sensitive/critical file, 123
testing, 435
state management
client-server architecture, 14
availability, 125
Cloud infrastructure/workspaces
confidentiality, 124
apply information, 145–150
state file, 126
521
INDEX
Cloud infrastructure/
Container Storage Interface (CSI),
workspaces ( cont. )
400
terraform.tfstate, 124
Continuous deployment (CD)
tfstate file, 125, 126
developers/administrators, 8
workspaces
docker image, 9
access settings, 132
GitHub actions, 194, 195
API token screen, 138
manifest file, 8, 10
CLI-driven workflow, 130
pipeline as code, 8, 9, 24
configuration, 131, 132
problems, 23–25
dev creation, 131
software engineering
environment variables, 136
approach, 8–11
login, 137–140
Continuous integration (CI), 5–7
modifying version, 133
GitHub actions, 194, 195
options, 129
Continuous monitoring, 12–14
organization screen, 129
scratch screen, 128
terraform variables, 136
D
variables tab, 134–137
Database
version control
configuration/secrets, 286–288
workflow, 129
implementation, 284
Code compatibility
module, 284–286
Mac M1, 517
PostgreSQL database, 283
Windows native (cmd.exe), 517
storing database, 286
WSL2 (Ubuntu), 518, 519
Delete resources
Command line interface (CLI), 67
account information, 507
attributes, 61
App NodeGroup, 509, 510
cloud infrastructure/
EKS Cluster configuration, 509
workspaces, 130
links, 508
environment configuration, 57
NAT gateway, 511
lacking automation, 57
network interfaces, 512
launching creation, 60, 61
OpenSearch cluster, 510
security group ID, 58
resources, 509–512
SubnetID, 59, 60
Terraform cloud
termination, 63
application, 507
522
INDEX
DevOps system, 2
dev and prod accounts, 156
central repository, 6, 7
init error, 157
challenges/limitations, 4
init reconfiguration, 158
continuous deployment (CD),
options, 158
8–11, 23–25
prod.hcl, 156
continuous integration, 5–7
variables, 157
Elasticsearch/Kibana, 12
TF variables, 159, 160
Infrastructure as Code, 14–23
methodology, 2, 5, 13
E, F
monitoring, 11–13
Prometheus/Grafana, 12
Elastic Compute Cloud (EC2), 67
requirements, 3
CLI tool, 57–64
SDLC model, 3
definition, 33
waterfall model, 2
instance selection screen, 44, 45
Domain name system (DNS)
metadata security, 407, 408
ACM certificate, 303
name and environment
authentication/authorization
tags, 48
(authz), 369
region selection, 40
delete records, 271–273
base operating system, 42
HTTPS certificate, 303
default screen, 41
ingress resource hostname, 303
launch instance screen, 42
load balancer controller, 299
search bar, 41
multi-environments, 301
virtual private cloud, 44
possibilities, 268
resources, 64
record creation, 299–304
security groups, 49, 50
subdomain, 270, 271
service control policies, 440
top-level domain, 269, 270
SSH key-pair generation
zone files/hosted zones, 268
creation screen, 52
Don’t Repeat Yourself (DRY)
final review screen, 51
domain name system, 301
gitops, 52
multi-environment, 156
instances, 53, 54
production environment
Launch information, 50
backend configuration
name and download
file, 157
screen, 53
523
INDEX
Elastic Compute
cluster process
Cloud (EC2) ( cont. )
access environment, 318–320
storage configuration
development
screen, 47, 48
environment, 317
tags, 47, 48
setup information,
termination, 56
316–318
user data script
user lists, 318
configuration, 46–48
components, 288, 289
version controlled
features, 289
system, 187–191
IAM Roles for Service
view instance
Accounts, 425–433
browser screen, 56
ingress controller, 297, 298
IP address, 55
Karpenter autoscaler, 489–494
launch status screen, 54, 55
module source, 291
Elastic, Fluent Bit (EFK), 472
secrets management, 413, 414
Elastic Kubernetes Service (EKS),
security groups, 295, 296
263, 399
security/secrets
access control, 390–393
components, 402
application
EBS device, 406, 407
components, 304
EC2 instances, 407, 408
default environment, 315
encryption keys, 403–405
deployment
PostgreSQL, 403
resource, 306–309
server setup, 290
ingress resource, 310–313
worker nodes, 292, 294
ingress/service/
Elastic Load Balancer (ELB), 303
deployment, 304
Event-Driven Architecture
namespace, 305, 306
(EDA), 458
NodePort service, 309, 310
providers, 313, 314
G, H
variables, 314
YAML file, 305
GitHub
architecture, 289
automation, 169
authentication/authorization
API-driven workflow,
(authz), 373–385
210–213
524
INDEX
code walkthrough, 207–209
output.tf, 246
login token, 209, 210
process, 243
CI/CD operations, 194, 195
dev (pull request)
docker image, 199–202
branches, 250
github/workflows, 196
cloud application, 255
GitOps process, 221
comments, 251
HTML template, 203
creation, 248–256
Jenkins stages, 195
GitHub actions, 252
logs, 206
init/validate/plan review
remote repository, 202
screen, 253
repositories, 264–273
IP addresses, 255
security/secrets
merge option, 254, 255
management, 397
Prod, 256–259
Spring Boot app, 263
repository online, 249
trigger, 202–207
staging/branches, 250
workflow stages, 204, 205
prerequisites, 222
YAML file, 196–198
production
GitHub Actions, 8
environment, 239–242
GitOps
pull request (PR), 221
business applications, 26
staging environment workflow
components, 30
backend.tf file, 226
environments, 26
code walkthrough, 224–231
infrastructure deployments, 26
directory structure, 224
manifests, 28
GitHub repository,
pipeline, 30
233–235
process, 27, 28
high-level plan, 222–224
PUSH/PULL, 28
infra-staging.yaml,
GitOps process
225, 226, 228, 230
clean-up section, 259, 260
scenario, 227, 228
complete workflow
set up, 231–233
developer testing, 247, 248
staging and prod
diagram, 245
environments, 228
feature request, 245, 246
staging branch workflow, 237
main.tf file, 245
terraform apply, 237, 238
525
INDEX
GitOps process ( cont. )
IAMAdministrator permissions
variables tab, 232
Policy, 346
workflow execution,
IAMAdmin role, 345
235–239
IRSA access key, 424–432
workspace variables, 233
organizations/user access, 339
Grafana application
password policy, 344
credentials, 484
permissions table, 355
dashboard, 485, 486
security/secrets
logging process, 485
management, 400
monitoring metrics, 488
self-managed group, 347
Prometheus selection, 487
user_role_mapping, 352
upgrading Kubernetes, 495
users module
Graphical user interface (GUI),
implementation, 342–347
40, 67
Immutable infrastructure, 19
Infrastructure as Code (IaC), 156
I, J
configuration tools, 18
mutable vs. immutable
IAM Roles for Service
infrastructure, 18–20
Accounts (IRSA)
provisioning tools, 17
account resource, 428
requirements, 14–23
authentication/
server infrastructure
authorization, 424
advantage, 17
internal working, 426, 427
client-server architecture, 14
module implemention, 429
container orchestration
OpenID Connect, 424
system, 16
permissions policy, 427–432
Dockerfile, 16
policy resource, 428
terraform code, 17
secret manager, 427
virtualization, 15
service account creation, 431
state, 20–23
Identity and access
Terraform state, 20
management (IAM), 323
tools of trade, 17, 18
cross-account roles
Instance Metadata
function, 348–355
Service (IMDSv2), 407
groups, 345–348
integrity, 125
526
INDEX
K, L
access keys, 499
account deletion error, 501
Karpenter autoscaler
close account, 501, 502
deployment replicas, 489
destroy global plan, 500
deployments, 490, 492
development environment,
Helm charts, 488
498, 499
installation, 489
CloudWatch alarm
nodes, 493
bucket creation, 459
nodes/metrics, 490
configuration, 461, 462
vertical/horizontal
EDA infrastructure, 458
scaling, 488
root login alarm, 462, 463
Key Management Services (KMS),
root login breach count, 464
403–405
send email/text
Kubernetes, 288
notifications, 459
SNS configuration, 459, 460
M
code update, 449–452
Mutable vs. immutable
executing infra, 454, 455
infrastructure, 18–20
global folder, 452, 453
infrastructure, 449
infra system, 453
N
Karpenter autoscaler, 488–493
Networking
logging infrastructure, 472–483
code description, 277
master account login, 464–470
high-level architecture, 276
admin role privileges, 465
module/vpc folder, 279, 280
GitOps user credentials, 465
networking.tf file, 277
navigation, 469
security groups, 282, 283
root credentials, 464
tags, 280, 281
streams, 470
switch role console, 466, 468
O
monitoring
Grafana application, 484–487
Observability
one-stop solution, 483
ALB access logs, 470–472
Prometheus/Grafana/
cleaning process
Metrics server, 483, 484
527
INDEX
Observability ( cont. )
Organization units (OUs)
OpenSearch, 449
member accounts
creation, 472, 473
creation, 332
data adding, 475
duties/responsibilities, 328
definition, 472
email/names configurations,
discover page, 479
333, 334
EFK/Kibana, 472
high-level view, 328, 329
index pattern, 476
identity account, 330
Kubernetes logs, 480, 481
management account, 329
login console, 474
Terraform creation, 330, 331
logstash pattern, 477
providers, 336–340
post authentication, 475
root account, 326
scalability and security, 472
limitations/drawbacks, 328
test data, 482
management account, 327
timestamp selection, 478
operating model, 327
viewing data, 482
organization trail
P, Q
CloudTrail logs, 455
configuration, 456, 457
Production environment
enable option, 456
definition, 239
features, 456
pull request page
logging configuration, 458
GitHub action, 257
master account, 458
main/staging
service principal, 456
branches, 256
standard process, 455
terraform apply, 258, 259
upgrading Kubernetes
SSH key-pair generation
apply operation, 494
apply execution, 242
cluster creation, 494
AWS command, 240
cluster process, 498
checking-in prod.hcl, 241
execution plan, 494
steps, 240
Grafana dashboard, 495
trigger, 242
modification, 493
workspace configuration,
nodes, 496, 497
239, 240
528
INDEX
R
global folder, 400, 401
IAM Roles for Service
Respiratory Distress
Accounts (IRSA), 425–433
Syndrome (RDS)
infra, 402
security/secrets management,
instance_type
410, 411
configuration, 446
Role-Based Access
Kubernetes master node/
Control (RBAC), 375
control plane, 402–408
RDS service, 410, 411
S
secrets exposure, 411
Secrets management
service control policies,
AWS design
438–445
current solution, 414, 415
Server-Side Request
definition, 418
Forgery (SSRF), 407
deployment file, 422
Service Control Policies (SCP),
descriptor file, 422
329, 400
installation, 419
action, 441
new solution, 415, 416
Checkov branch, 442
resource definition, 420
decode-authorization-
store CSI driver, 416–424
message, 444, 445
design, 414
InstanceType limitation, 443
Kubernetes deployment
testing, 442
descriptions, 413, 414
configuration, 441
password string, 412
definition, 438–445
terraform state, 411–413
EC2 instance types, 440
Security Assertion Markup
initialization, 438
Language (SAML), 424
tag policies, 439, 440
Security/secrets management
Simple Notification Service (SNS)
ALB logs, 408–410
notification, 460
Checkov, 397
subscription confirmation,
Checkov scanning, 432–438
459, 460
code update, 397–400
Source Code
dev environment, 446, 447
Management (SCM), 169
529
INDEX
Spring Boot app
cloud/workspaces, 123
application, 304–316
code folders, 71
database, 283–288
command iteration
destroy environment, 320
data source, 94, 95
domain name, 299–304
output declaration, 97–99
execution plan
problem execution, 91, 92
access process, 318–320
resources, 95–97
development environment,
Ubuntu package
317, 319
repository, 96
EKS cluster, 316–318
variable declaration,
infrastructure, 316
92–94
GitHub repository
commands reference, 121
auto apply, 268
core components, 69, 70
DNS records, 268–273
destroy commands, 119
pgitops folder, 264
drift
pushing code, 265
actions tab, 114, 115
single directory, 264
additional security group
terraform cloud
rule, 115
workspaces, 267
code execution, 113
TF_API_TOKEN, 266, 267
definition, 112
verification, 266
reconciliation, 116–118
kubectl utility, 263
rule edition
Kubernetes, 288–299
confirmation, 116
networking, 276–283
security groups section,
requirements, 263
113, 114
solution architecture, 273–276
tfstate file, 118
GitOps process, 221
T, U
iteration
apply command, 82
Terraform
dependencies, 73
aspects, 70
destroy, 87–91
automation, 169
documentation, 73
530
INDEX
folder structure, 76
version, 71
init command, 75–77
Terraform Cloud destroying
main.tf file, 72, 73
problem, 513–515
plan execution, 77–81
state file, 82–87
V, W, X, Y, Z
working directory, 74, 75
iteration1 code, 68
Version Controlled System
prerequisites, 67, 68
(VCS), 171
provision/configuration, 68
automation, 176
selective destroy
driven workspace
code execution, 109, 110
advanced options, 180, 181
deletion protection, 112
configuration, 182
main.tf file, 107
GitHub repositories, 179
output declaration, 108
working directory, 182
protection, 110–112
limitation, 194
security groups, 107
manual trigger
Spring Boot app, 263
apply completed, 191
third iteration
deployments, 191
alphabetical order, 100
EC2 code, 187, 188
code structure, 101, 102
fine tuning branch settings,
coding perspective, 99
191, 192
implementation, 99
GitHub repository, 188, 189
implicit/explicit, 100
infra folder, 187
modularize, 100
plan execution, 189, 190
module declarations/
server, 191
invocation, 103–108
Virtual private cloud (VPC), 44
531