
P ower Pivot is a technology that allows complex information to be processed and analyzed very efficiently and quickly. Its main feature and the one that gives it enormous speed is that it is an "In-Memory" technology, that is to say, it has all the data in memory with high compression, to decrease the space it takes up and increase the speed of analysis. These data models are based on tables and relationships.
It has three "flavors" or presentations:
- Power Pivot for Excel: is an add-in for Excel that contains all this technology and allows you to manage these models from new menus integrated into Excel itself. Its use is oriented to the Personal BI.
- Power Pivot for SharePoint: Allows you to manage Power Pivot worksheets on a SharePoint server. Both the data processing and the display are managed on this server. Its use is oriented to the departmental BI.
- SQL Server Analysis Services Tabular Model (SSAS): these are "In-Memory" databases managed by Analysis Services through its analytical engine, a service-oriented to servers and their administration by qualified IT personnel. Its objective is to have centralized corporate information and to serve all users in the company simultaneously with very fast response times. Supports larger storage volumes, management is optimized for simultaneous use by many users. Finally, it should be noted that it allows for the automation and scheduling of the loading of information from the data sources to the model. Its use is oriented to Corporate BI.
At this point, we will focus on the Excel add-in, which allows business users to create their own analytical models and populate them with information from a variety of data sources, independent of the IT department. In addition, a model created in Excel can be shared in SharePoint or imported from SSAS (with the help of qualified from the IT department), reusing everything that the business user has developed in Excel.
Power Pivot for Excel is an add-in for Excel that allows us to integrate and structure in tables the information from various data sources, and this information is stored in the files ". xlsx" with a high degree of compression, and at the moment they are opened they are read and loaded completely into memory, which allows for a speed of calculation not seen until now in Excel, as well as the possibility of storing large quantities of rows, many millions of rows, thus overcoming the limitations (approximately 1 million rows) and slow speeds that we have when there are a large number of rows in traditional Excel sheets.
To give you an idea of the high compression that can be achieved, let's take an example with real data, made by SolidQ. We have a model with four boards:
| Clients | 18,848 rows | 29 columns |
| Date | 2,191 rows | 19 columns |
| Products | 606 rows | 36 columns |
| Sales | 6,341,790 rows | 26 columns |
It occupies a size of only 26.3 MB. Note that the compression may be lower, as it depends on the redundancy of values in each column, and in this case, the redundancy is quite high.
In addition, it includes a powerful formula language called DAX (Data Analysis Expressions) that greatly increases the analytical calculation capacity and response speed.
Whether you are a mid-level Excel user and are getting your company data by exporting reports and queries from your applications and/or by copy and paste operations. And if you are an advanced user who discovers and struggles every day with the VBA language to try to obtain analytical solutions with some dynamism and without having to do tedious and repetitive manual tasks to obtain updated data from your company and transform it for analysis, Power Pivot is the tool you need to make your life easier, spending less time on tedious tasks and more time analyzing your information and making better decisions.
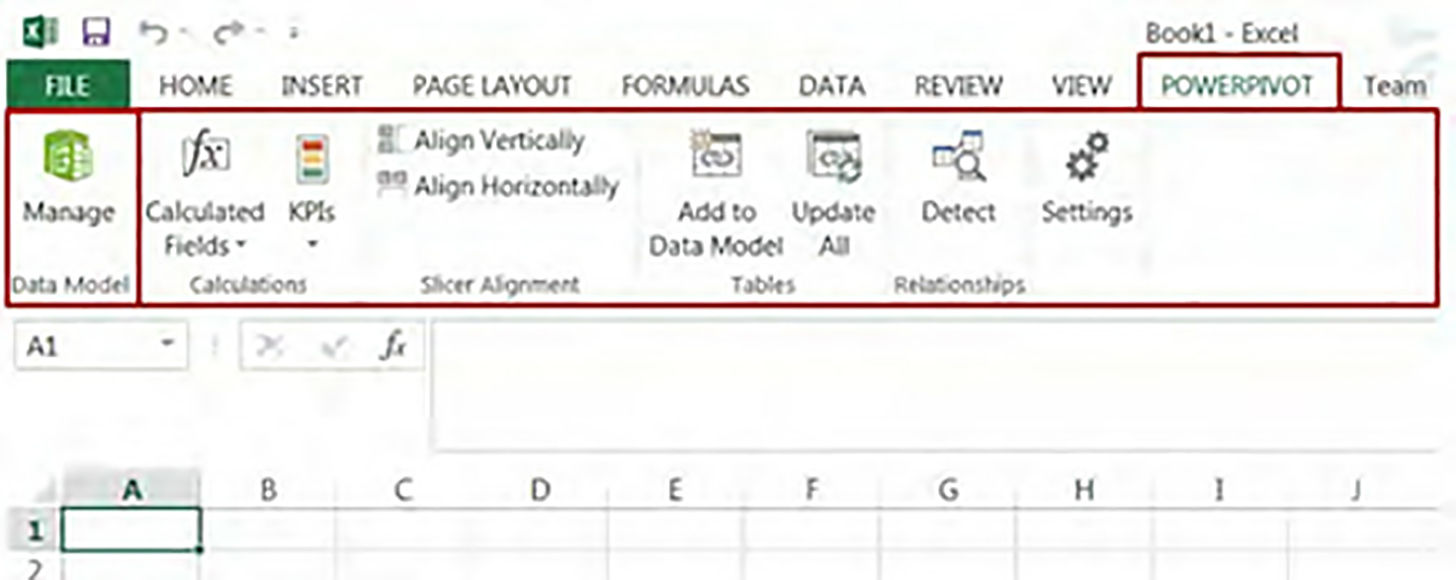
In short, more storage, easier access to external data, greatly increased calculation speed and a new formula language with much more computing power. Power Pivot is the new end-user-oriented information storage and analysis tool that is fully integrated with Excel. As you can see in the following image, its interface is a new menu in the Excel ribbon.
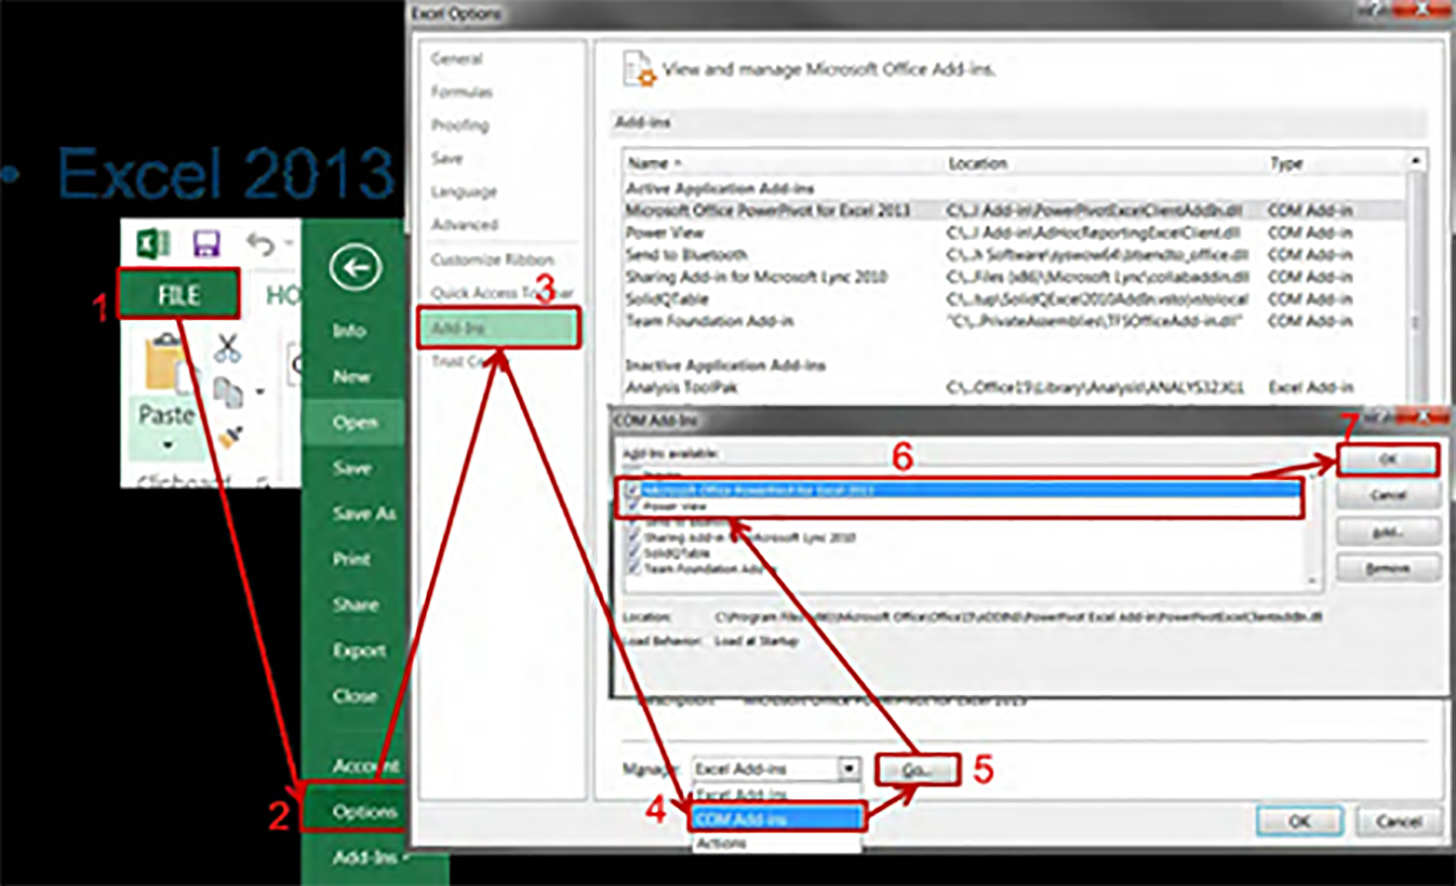
The Power Pivot add-in is not enabled by default in Excel 2013. To enable it, you must follow a series of steps that are summarized in the following image:
One of the main elements is the "Manage" option that gives access to a new window with all the necessary elements for its management. In the following image, you can see this window.
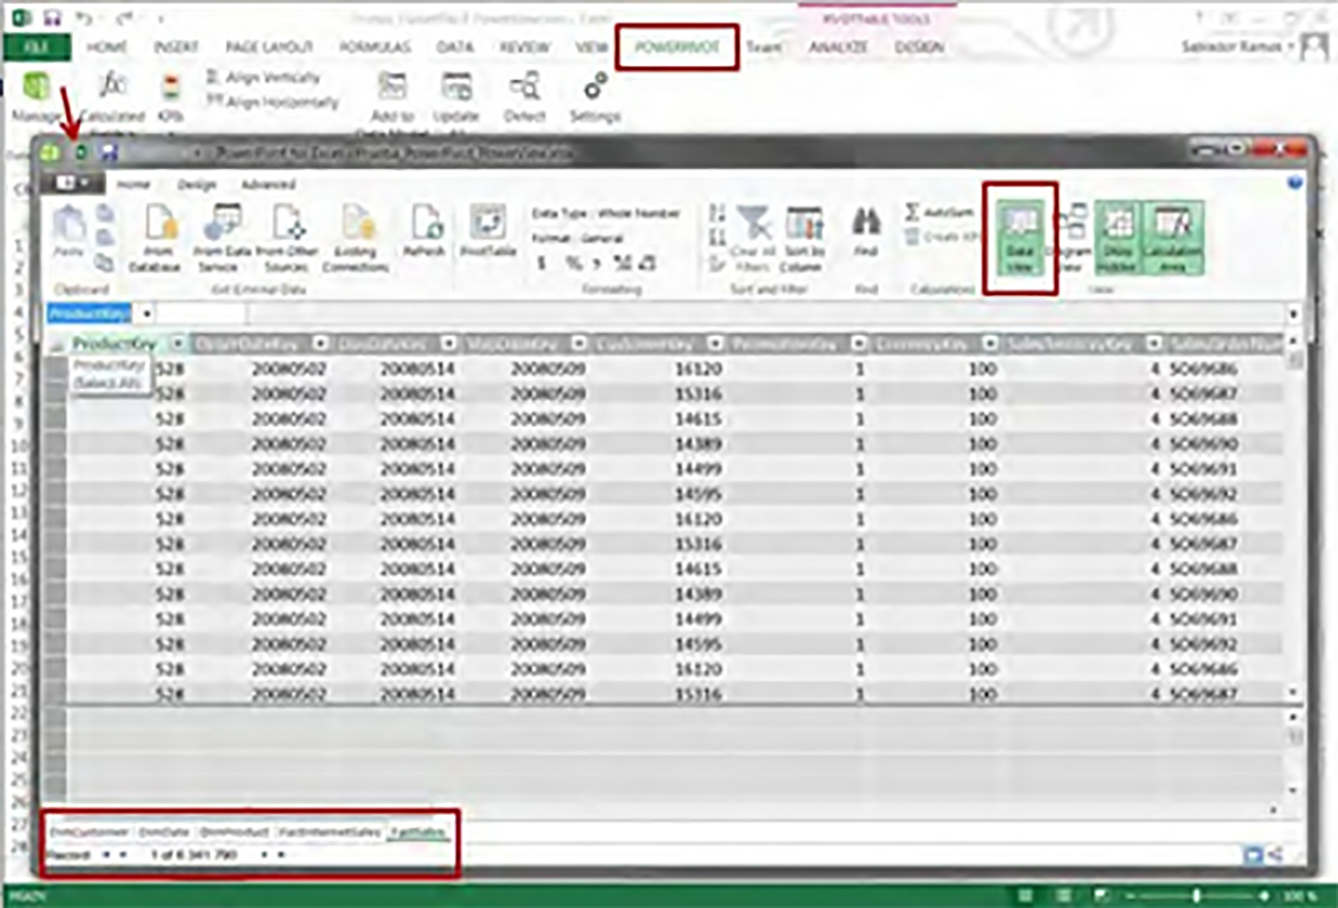
Note at the bottom left, where it indicates that there are 6,341,790 records in that table, something impossible in a traditional Excel sheet.
All the information, both from Power Pivot and traditional Excel, is stored in the same file ". xlsx". Note that Excel's autosave feature does not apply to the Power Pivot window, so you will need to save changes manually to avoid losing them in the event of an unexpected shutdown.
Finally, we will place Power Pivot along with the rest of Power BI for Excel components in the following image, to continue working on the understanding from a global perspective. Note that we have circled its location in red:
Power Pivot is the core of the Power BI for Excel components, without it, the existence of the rest of the components does not make sense since all the other tools need it as a starting point or destination:
- Power Query: reads data from sources, transforms it and stores it in
- Power Pivot.
- Power View: is a tool to visualize information stored in
- Power Pivot and on servers with SQL Server Analysis Services
- Power Map: is a tool to visualize and analyze geolocated information in different types of maps, from information stored in Power Pivot and servers with SQL Server Analysis Services.
From this moment on, already focused on Power Pivot for Excel, we are going to get to know all the details necessary for the creation of analytical models.
Power Pivot has the peculiarity, with respect to other similar tools on the market, that we do not create as such and from scratch a structure of tables and columns, with their data types and characteristics from a specific editor for this purpose. For the reader to understand what kind of tools I am referring to, I am going to put a Microsoft Access screen where the characteristics of each table in the database, and the columns that make it up, are defined visually:
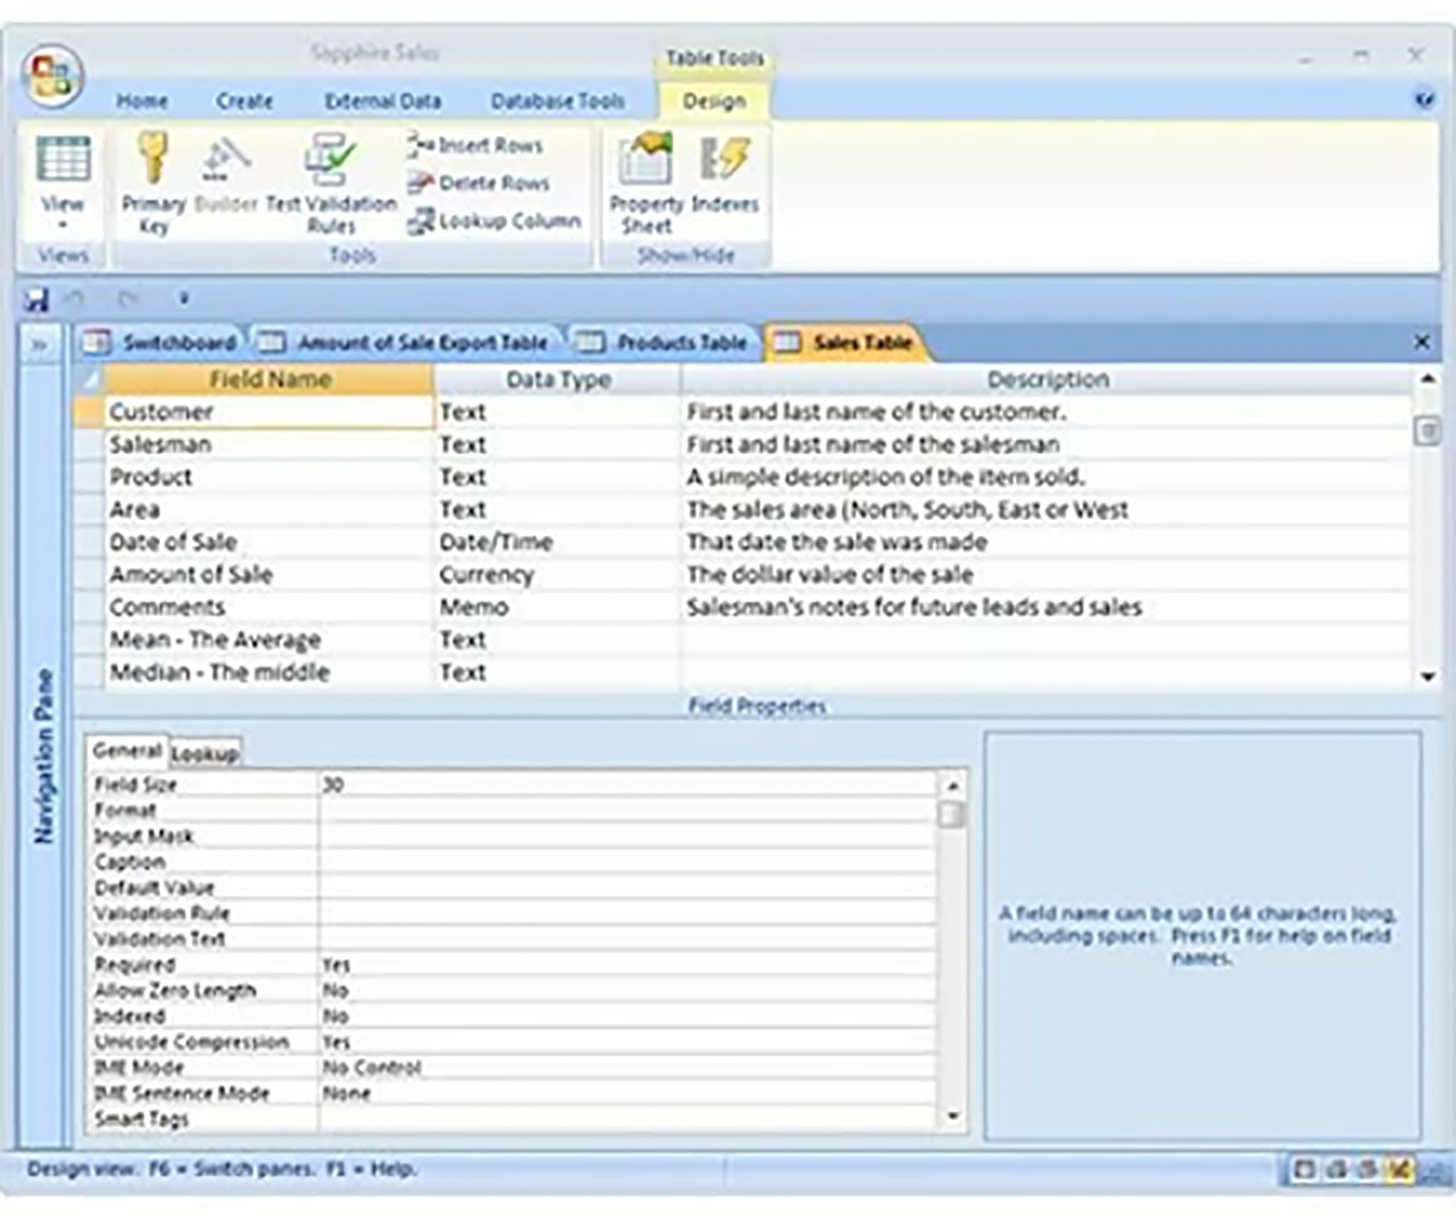
Table design in Microsoft Access
At Power Pivot, we have two ways of generating these storage structures:
- Using Power Query, a tool that we have studied previously, which allows us to extract data from the sources, apply a series of transformations to them and save them at the destination. Well, when we indicate that the process uses Power Pivot as a destination, what happens is that a storage structure is created, as we have defined it in Power Query, and once created, it imports the data selected in that process.
- Using the options for "Get external data," you provide
Power Pivot (we haven't studied them yet, they will be studied later)
Once these structures have been created, we can access them by opening the Power Pivot administration window. To do this, we click on the "Manage" option, which is located on the left side of the "POWERPIVOT" menu, from which we have access to all the options it provides.
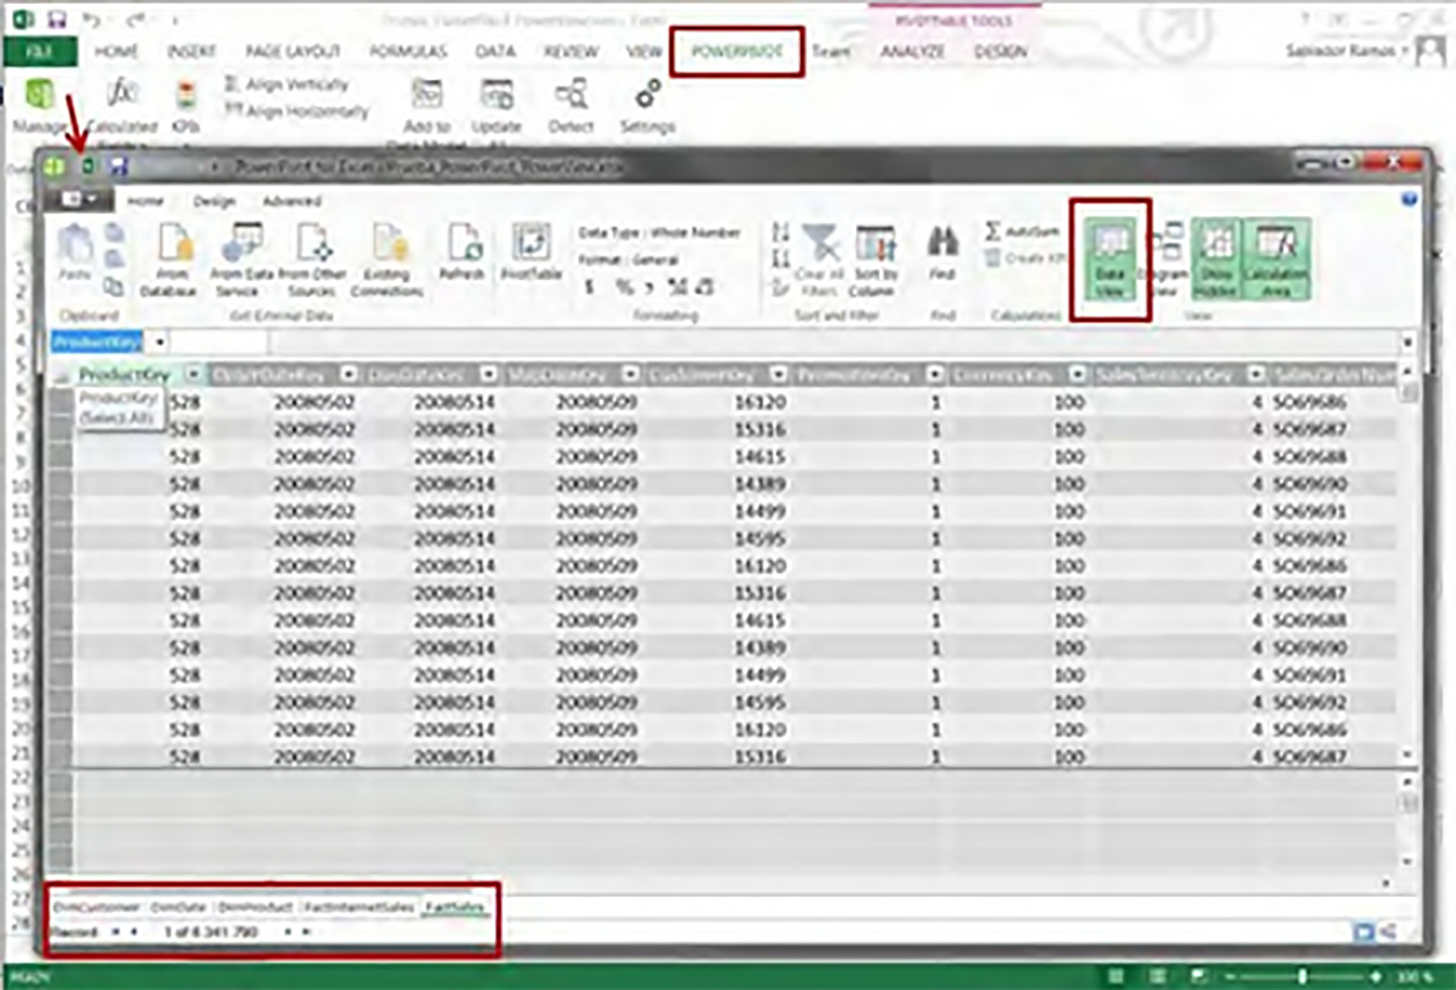
Power Pivot Management Window. Data view
We will now study each of these "ribbon" menus and each of the groups of options and choices that make up the ribbon.

Ribbon, 'Home' menu
Group of options ' Clipboard ': these are options related to obtaining data from the clipboard. It will be studied later.
Group of options ' Get External Data ': these are options related to obtaining data from various sources from the Power Pivot itself, without using Power Query. It will be studied later.
Group of options ' Refresh ': these are options related to the maintenance of data of the model, it allows to update the data of the whole model (option Refresh All) or only of the selected table (option Refresh ). Completely removes the content and re-extracts it from the source, transforms it, and loads it: no incremental loading, only full loads.
Group of options ' PivotTable ': allows us to create dynamic tables and/or dynamic graphics connected to the model with a single click, opening the Excel window again and showing us the tables and graphics ready to make queries about the model. It is simply an option that improves usability and avoids us having to do all of the above step by step.
Group of options ' Formatting ': these are options relating to the consultation of the origin of data.
- Data Type : allows to change the data type that has been assigned to each column. It is very important to apply the right data types, it is good practice, and it helps to optimize storage and response times. The types of data available are:
- Text
- Date
- Decimal Number
- Whole Number
- Currency
- TRUE/FALSE
- Format : allows you to choose from a series of formats that will depend on the type of data in that column. For numerical data types, you can choose from the following formats:
- General
- Decimal Number
- Whole Number
- Currency
- TRUE/FALSE
For data types Date, Date/Time, and Time you can choose from a variety of formats, more or less extensive, to represent that date/time.
- Currency symbol assignment. This and the following icons behave in the same way as in traditional Excel sheets.
- Display as a percentage, note that it multiplies the value stored in Power Pivot by 100.
- Format: format with a thousand separator.
 The number of decimals is increased or decreased.
Let's go a little deeper into the types of data. Each column is assigned a data type, which by default is automatically assigned according to the data type of each column of the origin, but you should review it manually, to improve it if possible, and reassign a more appropriate data type if you consider it appropriate and, of course, if it is compatible and allows you to store the values obtained from the origin. By this, I mean that, for example, if you have a column with customer names, you can't turn it into a type of numerical data. These data type changes have to be done manually in Power Pivot once the table and its columns have been created after the first import of the data (which is when the data types are assigned).
You should take into account the following aspects in terms of data types and format:
- The type of data affects storage, while the format only affects the display. You cannot assign data types that do not allow you to store the values that the data in that column has.
- Do not assign inconsistent formats for the chosen data type, although in some cases, this is allowed. It doesn't make sense to have a type of data
- Integer' and in format to assign two decimals (although always worth ".00" is confusing).
- The format 'Currency' does not make conversions: 142.84?
Group of options ' Sort and Filter ': these are options related to sorting and filtering of the data.
- A-Z : Sort in ascending order by the selected column.
- Z-A : Sort down the column by choosing
- Clear Sort : removes any sorting that we have enabled with the previous options.
- Clear All Filters : eliminates the established filters, leaving all the rows of the table visible.
- Sort by Column : allows sorting the data of a column by the values of another different column. Although at first sight, it may seem very strange, it is actually very useful, let's see an example of use: we have a column with the name of the month, in ascending order, so the first month would be April and the second would be August (alphabetical order of the names of the months), but we need the chronological order and the first month to be January, the second February, and so on. How do we solve it? So we should have a column 'MonthName' with the names of the months and another 'Month' with the numbers of the months from 1 to 12; then we use this option and tell you to sort the 'MonthName' column by the values in the 'Month' column. Find' option: allows you to search the contents of the model tables. It is equivalent to that option in Excel.
- Group of options ' Calculations ': these are options that allow us to create calculated fields quickly and KPIs. We will study them in part, dedicated to DAX.
- Group of options ' View ': gives access to the different display options:
- Data View shows the data view (see figure above showing Power Pivot Management Window).
- Diagram View : shows the diagram view (you can see it in the following image). It shows the tables and relations in the form of a diagram. This is also where the Hierarchies are managed through the icon at the top left of each table (remember that it only appears when this table is selected).
- Show Hidden : shows or hides the columns we have marked as "hidden in client tools." These columns are those we need internally, usually for calculations, and establishing relationships, but they do not contribute anything to the user during the analysis, but on the contrary, introduce "noise" as they are columns that he does not know and will not use.
- Calculation Area : shows or hides the "calculation area," which is that grid at the bottom where we define the fields calculated by DAX (we will study this area later).
To create a hierarchy you must be in the diagram view and click on the specific table you want to create the hierarchy on, and you will see that it is marked in a different color and that two icons appear at the top, to the right of the table name, you must click on the icon, then you must assign a name to this hierarchy and drag columns from the same table to create the different levels we want it to have. Note that a hierarchy cannot use columns that belong to another table than the one you created.
Group of options ' Columns ': they are options related to the treatment of the columns of a table in the Power Pivot Management window.
- Add : allows you to add calculated columns to a table. This option will be seen in detail when we study the DAX part.
- Delete : it allows you to delete columns from a table.
- Freeze : allows fixing columns, so that they remain visible when scrolling horizontally. It does not affect at all how users will see it in the pivot tables, and it only affects the display of the table in the Power Pivot Management window.
- Width : allows you to adjust the width of the column in pixels. It only affects the display of the table in the Power Pivot Management window.
Group of options ' Calculations ': these are options related to the execution of calculations using DAX expressions.
- Insert Function : applies to the formula bar, it helps us when writing DAX expressions, allowing us to use a search form about the available functions.
- Calculation Options : Allows calculations to be performed automatically, i.e., every time you enter or change a DAX expression, the values are recalculated. The advantage is that you have the result immediately, but the more DAX expressions you have in the model, the slower any change is made (it recalculates all of them, not just the one you have modified). Therefore, from here, you can change the option to 'Mode Manual calculation,' so the calculations will only be made when you decide, that is, when you press the option on that same button, called 'Calculate now.' It is common practice to remove the 'Calculation automatic' while we are designing the models, thus achieving shorter waiting times when writing DAX.
Group of options ' Relationships ': these are options related to the management of relationships between tables.
- Create Relationship : a relationship is established based on a column in a table that is related to another column in another table. Both have to be the same type of data. This is the form that allows us to create a relationship.
- Manage Relationships : allows you to create, modify, or delete relationships.
You can also create relationships from the ' Diagram View ' by clicking on the source column of the relationship and dragging and dropping on the target column of the relationship, as shown in the image:

Releasing the mouse will create the relationship between these columns in both tables.
Relations - besides being between columns of different tables and having the same type of data, we must coherently create them. For example, even if the product code is numerical and the supplier code is also numerical, there is no point in establishing a relationship between the two (even if the tool allows me to), and we would get totally false and inconsistent analytical data.
Therefore, when establishing relationships, we are going to do so based on the relationships defined in our documentation of the model, which is where it is already studied in detail and set down in writing what relationships there should be between the tables of the model and through which columns they are to be carried out, all of this applying the good modeling practices studied. Here we will merely do the operational part of physically creating them in Power Pivot based on the documentation.
Next, we are going to mention a series of limitations that we have when creating these relationships, and that partly affect the design of the model, although if we follow the good modeling practices studied, we will be given this casuistry in fewer occasions:
- Only one column can be used for each table involved in the relationship. Although this aspect is reflected in the form, where you can only select one column, we want to highlight it here because other tools allow several columns from each table to be involved in the relationship.
- There can only be one active relationship between two tables. For example, if I have a sales table with three dates (sale date, shipment date, and collection date) I will have to establish a relationship for each of these columns with the table of the dimension 'Date,' but only one of them can be active, leaving the other two as inactive. An active relationship is the one Power Pivot uses by default to obtain information from two related tables. If we need to use an inactive relationship, we will have to do it using DAX expressions in which the inactive relationship to be used is expressly indicated.
- It only allows for one-to-one or one-to-many relationships.
- Relationships between two columns in the same table are not allowed (self-referenced relationships).
- Circular relations are not allowed, that is, if table1 is related to table2 and table2 to table3, table3 cannot be related again to table1.
Option ' Table Properties ': allows you to edit the table properties. As we explained before, there is no designer for this, but the structure of the table comes from the result of obtaining and transforming data from Power Query or from the options to 'obtain external data' included in Power Pivot. If we have used Power Query, in the form, you cannot make any modifications to the process made with Power Query, but you have to go to Power Query and make the appropriate changes. If the process was done with any of the options in the menu ' Get External Data' of Power Pivot, from here, we would have access to consult and modify it.
Option ' Mark as Date Table ': allows you to select which is the Date table. This table corresponds to the Date dimension, which we studied in detail previously. With this option, we must assign this table and mark which column has the data type Date. From that moment on, the time intelligence functions that are part of the DAX language are enabled. Basically, in Power Pivot, at the model creation level, you only have to make this assignment. The bulk of the work is to include in the dimensional model a 'Date' dimension that compiles all the time treatment needs of each business and, later, to include the calculations through DAX expressions that help to enrich the analysis.
Group of options ' Edit ': these are options to redo and undo.
- Undo : undo.
- Redo : redo.

Ribbon, 'Advanced' menu
Group of options ' Perspectives ': these are options relating to the management of perspectives. Perspectives are subsets of model elements that allow for simplified navigation. Let's suppose that we have a sales model with diverse information related to the stores, but not all of it provides value for the analysis that our sales team is going to carry out, although it is useful for other departments.
Therefore we can make a personalized view that only shows the selected elements that the commercials need, avoiding them to have a hard time finding what they need among a lot of information that they will never use. In the following image, you can see that the perspective called 'Commercial,' where instead of having access to all the data of the stores, only the fields will be offered: Category – SubCategory - SalesTerritoryCountry, SalesTerritoryGroup, SalesTerritoryRegion:
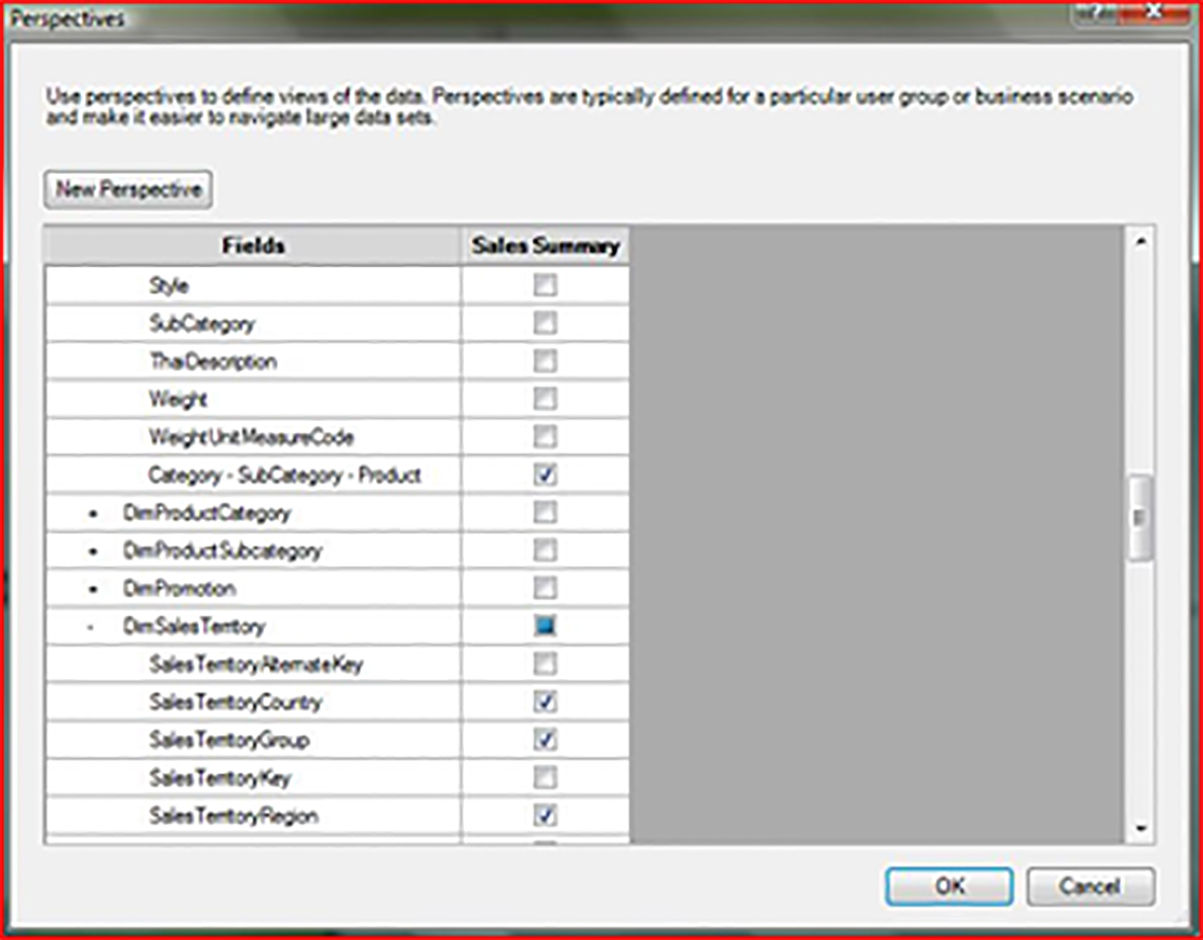
Selection of fields from a Perspective
- Create and Manage : allows you to create and manage perspectives .
- Select : allows you to select one of the existing perspectives. When you select a perspective, you only see the fields that are marked in it.
- Show implicit Calculated Fields : shows or hides the calculated implicit fields. These fields are those that are created when you drag a numerical column into the value zone of a pivot table or pivot chart, using the summation aggregation function by default. From their first use, they appear in the grid of the administration window automatically. The appearance of Implicit Calculated Fields can be avoided to a great extent by applying a good practice that consists of creating all the calculated fields that we need and assigning them the appropriate format, and then marking the columns from which they are calculated as not visible in client tools (as they are not visible we will not be able to use them and, therefore, no implicit calculated fields will be created from them).
- Summarize By : indicates the aggregation function (sum, min, max, ...) that you will use by default when you create a field calculated implicitly by that column.
- Default Field Set : it is the default set of fields that will be shown in the client tools when we directly select a table of the model, besides it will do it in the order that they appear in the box on the right side of the form. If we don't define this set of fields, it will show all the fields in that table, in the same order as they appear in it.
- Table Behavior : Allows you to define certain advanced visualization options in client tools. For example, we can configure the behavior of some features of this table when we use it in Power View.
As a summary we show the way we have walked so far with what we have seen on Power Pivot, to give you an idea of the road we still have to walk, and that we will cover it in the section dedicated to the DAX Language:
Evolution and learning process of Power Pivot and DAX
All these advanced options, to understand in detail all their possibilities, need to be defined and then check their behavior in the client tools, mainly pivot tables, dynamic graphics, and Power View.
Here is a summary of the steps we recommend you follow to create an analysis model with Power Pivot:
- To have the logical design of the dimensional model to be created. It is very important to have applied the studied good practices, and it will avoid many problems, as well as unnecessary complexities in the DAX expressions that will be made later.
- Use Power Query and/or Power Pivot's own data collection tools to extract the data from the sources, transform it according to the established model and save it in Power Pivot.
- Use the design options offered by Power Pivot, applying the good design practices studied, to improve the model, i.e.:
- Assign suitable data types and define formats that improve the display.
- Manage the relationships between tables (based on the model documentation)
- Create hierarchies (based on what is defined in the model documentation).
- Make adequate time treatment (Date Table).
- Enrich the model with DAX, creating calculated columns, calculated fields (measurements), and KPIs.
So far we have studied how to perform most of the process, we know how to create dimensional models and make the logical design, we know how to perform ETL processes (extraction, transformation, and loading) using Power Query and make the appropriate improvements to the model.
We still have to obtain external data from the Power Pivot itself and know the DAX language to enrich the model. These points will be the ones we see below.
At this point, the reader will wonder why I have a menu available to obtain external data within the Power Pivot itself if I have Power Query ?
The truth is that it is a totally logical question and that we have also asked ourselves, the main reason we found is that when Power Pivot came out in 2010, there was no Power Query (which appeared in 2014). Therefore the tool itself incorporated the possibility of obtaining external data from different sources.
Nowadays, there are a lot of Excel files that have used these options in them, and on the other hand, many users that have not installed Power Query, either because of ignorance (you have to download and install it separately) or to avoid new learning.
Therefore, at the moment, and this is a personal opinion: it is complicated to eliminate these options, although we believe that in the future they will be eliminated and they will be aligning everything in the same place because basically, the functionalities available in this menu are a subset of those that are available in Power Query; with some small exceptions, there are some data sources (like Informix and some other) that are in Power Pivot and not in Power Query.
If you already know Power Query, have experience with the tool, and have it installed on the computers you work with, you do not need to use any of these features from Power Pivot. However, if you decide to use them, with the knowledge acquired about Power Query, there won't even be a learning curve, just click on the menu options and follow the instructions, you won't have any problem understanding what the tool will ask you for. The only thing you will find is that there will be fewer steps and fewer options in the process of obtaining data, which will limit you, and you will not have as much flexibility as to when you use Power Query.
There will always be occasions, in both Power Pivot and Power Query, when you need to rely on IT staff to provide you with the connection data to the corporate servers.
Although we have commented that its use is optional, we will be looking at the options available.

Ribbon, 'Home' menu, 'Clipboard,' and 'Get External Data' option groups.
Group of options ' Clipboard ': allows you to paste data tables from
The 'clipboard' is stored as a table inside the Power Pivot. It is an option that is available, and that may seem useful and comfortable for you to use, but I advise you not to use it because it has more disadvantages than advantages.
Once the table has been created, you have no chance to make changes to it (I remind you that this is a feature of Power Pivot), the way to update it is by refreshing it with the data that is currently in origin. But there is an exception, which is precisely when they come from the clipboard since the clipboard is only stored in RAM, and therefore, there is no link to the origin once the table has been created. If you want to update the table, you must copy the data back to the clipboard and use one of the following options:
- Paste : creates a new table from the data in the clipboard; in it, we can only choose its name and if the first row contains headers or not. Later we can make improvements just like on any other table (change column names, data types, assign formats, etc.)
- Paste Append : paste the data, but adding it and keeping the data that was already in the table. It only works on boards that were created by pasting from the clipboard.
- Paste Replace : Paste the data, leaving only the data, and removing all the data that was previously in the table. It only works on boards that were created by pasting from the clipboard.
- Copy : allows you to copy the selected cells to the clipboard. It works like in Excel, or like in any other application that allows copying to the clipboard.
Group of options ' Get External Data ':
- From Database : it has a drop-down menu with the following options:
- From SQL Server : allows obtaining data from Microsoft SQL Server.
- From Access - allows you to obtain data from Microsoft Access.
- From Analysis Services or PowerPivot : allows you to obtain data from SQL Server Analysis Services (SSAS) or from SharePoint PowerPivot models. It is important to remember that data stored in the PowerPivot cannot be obtained from another Excel file.

- From Data Service : has a drop-down menu with the following options:
- From Windows Azure Marketplace : allows obtaining data from Microsoft SQL Server.
- Suggest Related Data : Suggests related data sources that exist in the Azure Marketplace.
- From OData Data Feed : allows obtaining data stored in Open Data sources.
- From Other Sources : a form appears with a variety of sources, including relational databases, Analysis Services databases, ' Data Feeds ,' text files, etc. This includes all previously viewed sources and additional ones.
- Existing Connections : shows a list of connections that we have already created on our computer so that we can reuse them without having to enter all the data necessary for the connection again. This data is stored in files with the extension ".odc."

