Data analysis using pivot faceting
As per the definition of pivoting in the Solr wiki, it is a summarization tool that lets you automatically sort, count, total, or average data stored in a table. Pivot faceting lets you create a summary table of the results from a query across numerous documents.
The output of pivot faceting can be referred to as decision trees. This means the output of pivot faceting is represented by a hierarchy of all sub-facets under a facet with counts both for individual facets and sub-facets. We can constrain the previous facet with a new sub-facet and get counts of the sub-sub-facets inside it. Let us see an example to understand pivot faceting.
Facet A has constraints as X,Y with counts M for X and N for Y. We could go ahead and constrain facet A by X and get a new sub-facet B with constraints W,Z and counts O for W and P for Z.
To understand better how pivot faceting works and hence how it could be helpful in analytics, let us see an example. Our index contains some mobile phones. Let us see the count of brands and the number of options having different memory capacities. The query will contain the following parameters for this faceting:
facet.pivot=brand_s,memory_i& facet.pivot.mincount=1& facet=true
In this snippet, note the following:
- The
facet.pivotparameter defines the fields to use for the pivot. Multiplefacet.pivotvalues will create multiplefacet_pivotsections in the response. - The
facet.pivot.mincountparameter defines the minimum number of documents that need to match in order for the facet to be included in results. The default value is1.
The complete query would be as follows:
http://localhost:8983/solr/collection1/select?q=*:*&facet.pivot=brand _s,memory_i&facet=true&facet.pivot.mincount=1
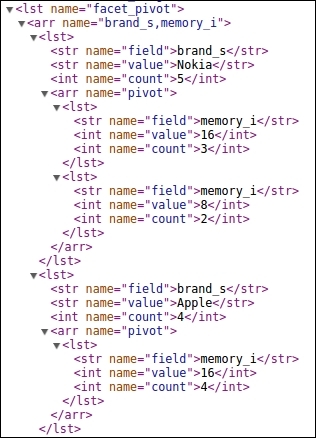
We can see that the output contains counts for all brands. Inside each brand, there are different memory options and their respective counts. A portion of the pivot faceting output is as follows. It shows two brands, Apple and Nokia, where Nokia has both 8 and 16 GB memory options but Apple has only a 16 GB memory option.

An interesting facet to watch over here is that of the price inside the discount percentage and brand inside memory options. The parameters to be added in our query would be the following:
facet.pivot=memory_i,brand_s& facet.pivot=discount_i,price_i
The complete query would be as follows:
http://localhost:8983/solr/collection1/select?q=*:*&facet.pivot=memor y_i,brand_s&facet.pivot=discount_i,price_i&facet=true&facet.pivot.min count=1
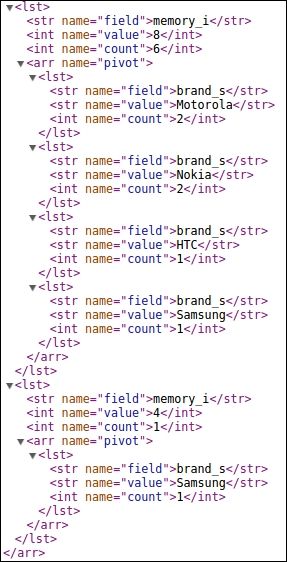
We have created multiple pivot facets here. The first is of brand inside memory:

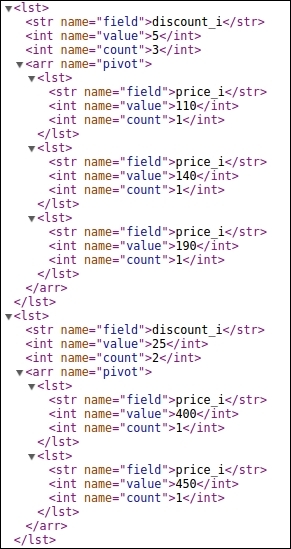
Another pivot facet is that of price inside discount as shown in the following image:

Pivot faceting can be used to generate summarization and decision tree–type analytical information out of big data, provided that we have the required data properly indexed into our SolrCloud. If we take the example of population analysis, we can create pivot facets on fields such as age, gender, and income and get a detailed location-wise summary.

