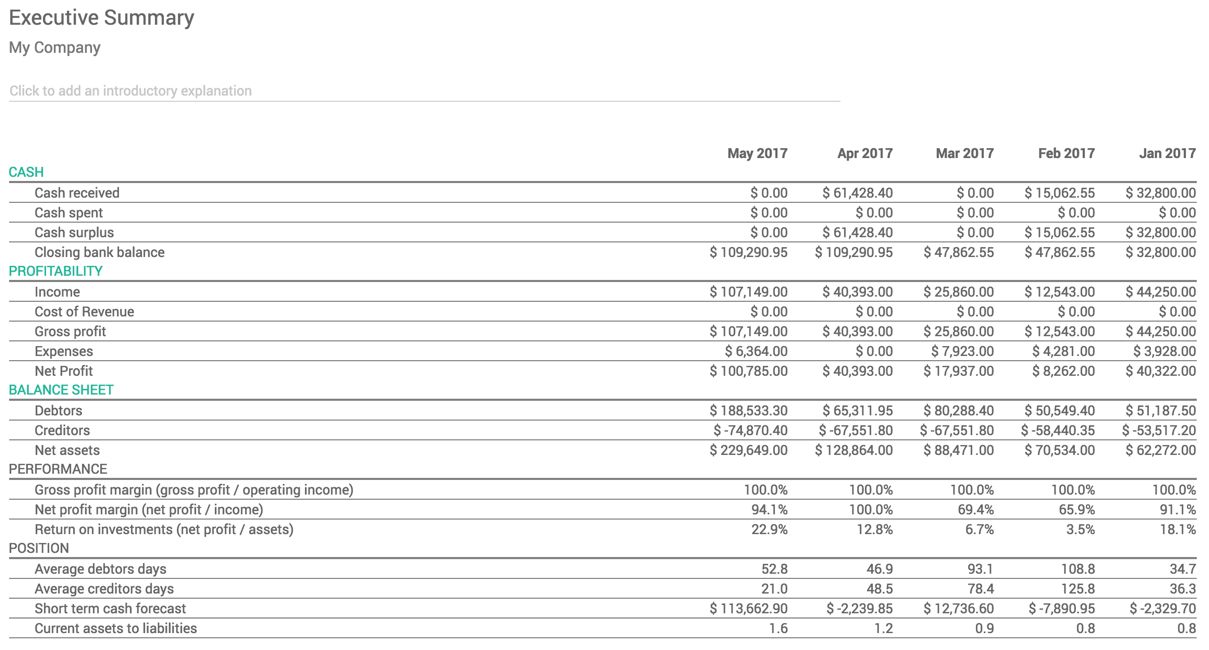
The Executive Summary report allows you to take a quick look at all the important figures you need to run your company, such as cash, profitability, payables and receivables, and statistics on the credit period. Look at the following sample report that shows you a number with a comparison of last four months:

The following terms, which are used in the reports, are explained as follows:
- Performance:
- Gross profit margin: This is the total sales achieved in the business less the direct cost to achieve those sales (that is, labor, materials, and so on)
- Net profit margin: This refers to the gross profit less the overhead costs to achieve the sale (that is, office rent, electricity, taxes and duties, and so on)
- Return on investment (p.a): This is the ratio of the net profit achieved compared to the assets used to make that profit
- Position:
- Average debtor days: The average number of days that your customers took to pay all invoices in full
- Average creditor days: The average number of days you took to pay all vendor bills in full
- Short term cash forecast: The cash is expected to come in this month and go out of the organization in the next month, that is, the difference between sales and purchases in the month.
- Current assets to liabilities: This is, typically, used to measure a company's ability to clear its debt. It is also called current ratio--the ratio of the current assets to the current liabilities.

