Книга: Practical Malware Analysis: The Hands-On Guide to Dissecting Malicious Software
Назад: Loading DLLs
Дальше: Exception Handling
). With this method, you’ll see the changes that occurred to every register for each instruction as you navigate.
Use the Trace Into and Trace Over options. These options may be easier to use than Add Selection, because you don’t need to select the code you wish to trace. Trace Into will step into and record all instructions that execute until a breakpoint is hit. Trace Over will record only the instructions that occur in the current function you are executing.
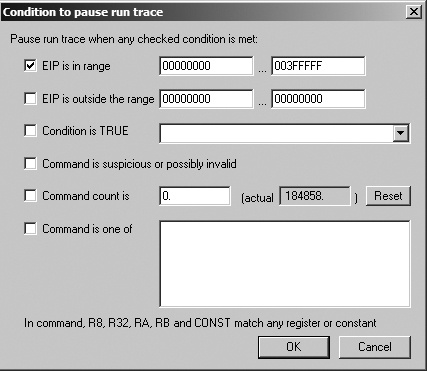
shows the condition we set to catch Poison Ivy’s heap execution. We set OllyDbg to pause when EIP is less than the typical image location (0x400000, below which the stack, heap, and other dynamically allocated memory are typically located in simple programs). EIP should not be in these locations in a normal program. Next, we select Trace Into, and the entire program should be traced until the shellcode is about to be executed.
In this case, the program pauses when EIP is 0x142A88, the start of the shellcode. We can use the - key to navigate backward and see how the shellcode was executed.
Назад: Loading DLLs
Дальше: Exception Handling
Войти в систему
Войти с помощью соц. сетей:

