These materials are © 2026 John Wiley & Sons, Inc. Any dissemination, distribution, or unauthorized use is strictly prohibited.

OpenTelemetry
Dash0 Special Edition
by Ayooluwa Isaiah
and Kasper Borg Nissen
These materials are © 2026 John Wiley & Sons, Inc. Any dissemination, distribution, or unauthorized use is strictly prohibited.
OpenTelemetry For Dummies®, Dash0 Special Edition Published by
John Wiley & Sons, Inc.
111 River St.
Hoboken, NJ 07030-5774
Copyright © 2026 by John Wiley & Sons, Inc., Hoboken, New Jersey. All rights, including for text and data mining, AI training, and similar technologies, are reserved.
No part of this publication may be reproduced, stored in a retrieval system or transmitted in any form or by any means, electronic, mechanical, photocopying, recording, scanning or otherwise, except as permitted under Sections 107 or 108 of the 1976 United States Copyright Act, without the prior written permission of the Publisher. Requests to the Publisher for permission should be addressed to the Permissions Department, John Wiley & Sons, Inc., 111 River Street, Hoboken,
Trademarks: Wiley, For Dummies, the Dummies Man logo, The Dummies Way,
Making Everything Easier, and related trade dress are trademarks or registered trademarks of John Wiley & Sons, Inc. and/or its affiliates in the United States and other countries, and may not be used without written permission. All other trademarks are the property of their respective owners. John Wiley & Sons, Inc., is not associated with any product or vendor mentioned in this book.
LIMIT OF LIABILITY/DISCLAIMER OF WARRANTY: THE PUBLISHER AND THE AUTHOR MAKE NO
REPRESENTATIONS OR WARRANTIES WITH RESPECT TO THE ACCURACY OR COMPLETENESS OF
THE CONTENTS OF THIS WORK AND SPECIFICALLY DISCLAIM ALL WARRANTIES, INCLUDING
WITHOUT LIMITATION WARRANTIES OF FITNESS FOR A PARTICULAR PURPOSE. NO WARRANTY
MAY BE CREATED OR EXTENDED BY SALES OR PROMOTIONAL MATERIALS. THE ADVICE
AND STRATEGIES CONTAINED HEREIN MAY NOT BE SUITABLE FOR EVERY SITUATION. THIS
WORK IS SOLD WITH THE UNDERSTANDING THAT THE PUBLISHER IS NOT ENGAGED IN
RENDERING LEGAL, ACCOUNTING, OR OTHER PROFESSIONAL SERVICES. IF PROFESSIONAL
ASSISTANCE IS REQUIRED, THE SERVICES OF A COMPETENT PROFESSIONAL PERSON SHOULD BE
SOUGHT. NEITHER THE PUBLISHER NOR THE AUTHOR SHALL BE LIABLE FOR DAMAGES ARISING
HEREFROM. THE FACT THAT AN ORGANIZATION OR WEBSITE IS REFERRED TO IN THIS WORK
AS A CITATION AND/OR A POTENTIAL SOURCE OF FURTHER INFORMATION DOES NOT MEAN
THAT THE AUTHOR OR THE PUBLISHER ENDORSES THE INFORMATION THE ORGANIZATION
OR WEBSITE MAY PROVIDE OR RECOMMENDATIONS IT MAY MAKE. FURTHER, READERS
SHOULD BE AWARE THAT INTERNET WEBSITES LISTED IN THIS WORK MAY HAVE CHANGED OR
DISAPPEARED BETWEEN WHEN THIS WORK WAS WRITTEN AND WHEN IT IS READ.
For general information on our other products and services, or how to create a custom For Dummies book for your business or organization, please contact our Business Development
. For information about licensing the For Dummies brand for products or services,
ISBN 978-1-394-39021-2 (pbk); ISBN 978-1-394-39022-9 (ebk); ISBN 978-1-394-39023-6 (ePub)
Publisher’s Acknowledgments
Development Editor:
Senior Managing Editor: Rev Mengle
Rachael Chilvers
Client Account Manager:
Production Editor:
Jeremith Coward
Umeshkumar Rajasekhar
Acquisitions Editor: Traci Martin
These materials are © 2026 John Wiley & Sons, Inc. Any dissemination, distribution, or unauthorized use is strictly prohibited.
Introduction
Modern applications run across clouds, services, and platforms, generating floods of telemetry that often feel more confusing than helpful. Without a standard, it’s difficult to connect the dots and truly understand what’s happening.
In this book we bang the drum for OpenTelemetry. It simplifies observability for powerful proactive monitoring and alerting.
About This Book
OpenTelemetry For Dummies, Dash0 Special Edition, provides the steps necessary to gain an understanding of OpenTelemetry and how to use it.
We cover several topics, including the following:
» Learning about observability
» Understanding why OpenTelemetry matters
» Observing how signals work together
» Providing context for Resources
» Troubleshooting pitfalls
» Determining what makes telemetry good or bad
» Managing observability with ten practical tips Icons Used in This Book
Throughout this book, different icons are used to highlight important information. Here’s what they mean: The Tip icon highlights information that can make doing things easier or faster.
Introduction 1
These materials are © 2026 John Wiley & Sons, Inc. Any dissemination, distribution, or unauthorized use is strictly prohibited.
The Remember icon highlights items you need to recall when searching your memory bank.
Sometimes, we provide you with a few additional tidbits of research or facts beyond the basics. If you’d like to know the tech-nical details, watch out for this icon.
Beyond the Book
If you want resources beyond what this short book offers, visit
to discover more about OpenTelemetry.
2 OpenTelemetry For Dummies, Dash0 Special Edition These materials are © 2026 John Wiley & Sons, Inc. Any dissemination, distribution, or unauthorized use is strictly prohibited.

IN THIS CHAPTER
» Understanding what observability
really means
» Explaining why complexity has broken
traditional monitoring
» Introducing signals, context, and
correlation
» Setting the stage for observability
with OpenTelemetry
Chapter 1
Understanding
Observability
The term observability gets tossed around a lot, often along-side dashboards, alerts, and logs. But what matters is that observability is the ability to understand what your system is doing and why. Especially when it’s not doing what it should.
It means having enough clues to answer questions such as:
» Why did the checkout fail for that user?
» What’s slowing down our mobile API?
» Why are we seeing more errors in the EU?
» Did we actually fix that bug, or is it still happening?
Ideally, you get those answers without having to dig through six dashboards, three log files, and two Slack threads.
CHAPTER 1 Understanding Observability 3
These materials are © 2026 John Wiley & Sons, Inc. Any dissemination, distribution, or unauthorized use is strictly prohibited.
Exploring Why Observability Matters More Now
In the past, systems were simpler. You had one app, one database, and a handful of users. If something broke, you knew where to look. But that world is gone.
Today, your architecture might look more like Figure 1-1: FIGURE 1-1: Modern system complexity.
You have:
» Dozens of microservices
» Connected databases and cache layers
» Queues and event-driven services
» Serverless functions that come and go
» APIs calling APIs calling APIs
» Multiple cloud regions or clusters With this much complexity, a single request might cross ten services before being completed. And when something goes wrong, finding the cause feels like playing detective in a murder mystery where everyone is a suspect.
4 OpenTelemetry For Dummies, Dash0 Special Edition These materials are © 2026 John Wiley & Sons, Inc. Any dissemination, distribution, or unauthorized use is strictly prohibited.
Traditional monitoring, focused on uptime and infrastructure metrics, can’t keep up; that’s why you need observability.
Examining what true observability
looks like
What if a user gets an error? With good observability, you can figure out:
“The request started in Service A, which called Service B. Service B tried to talk to Service C, but it was delayed because of slow database queries. That caused a timeout in B, which triggered the user-facing error.”
You didn’t need to deploy new code, or guess, or stitch together half a dozen tools. With observability, you’ll always have the right clues, in the right context, to figure out the problem, even if you never anticipated that it could happen.
Distinguishing observability
from monitoring
The difference between monitoring and observability lies in the questions they can answer. Monitoring addresses known questions, like “Is the system up?”, while observability helps you answer unexpected questions about your system’s behavior —
especially when it fails in unpredictable ways.
Imagine you’re the head chef in a busy, modern restaurant kitchen during the dinner rush. You have multiple specialized stations (the grill, the fryer, the pantry, and plating) that all have to work together perfectly to complete an order.
When things are running smoothly, it’s great. But what happens when a customer complains their food is taking too long?
» Monitoring is looking at the clock and knowing that the average ticket time is too high. You know that there’s a problem, but you don’t know why
» Observability is being able to ask, “Why is the order for table 12 delayed?” You glance at the order ticket and see it’s waiting on fries. You look at the prep station’s output counter and see it’s been at zero for 10 minutes. Then you hear a cook yell, “We’re out of potatoes!”.
CHAPTER 1 Understanding Observability 5
These materials are © 2026 John Wiley & Sons, Inc. Any dissemination, distribution, or unauthorized use is strictly prohibited.
By combining these clues, you found the root cause. This power comes not from guesswork, but from collecting rich signals that help you ask new unanticipated questions in real time, and get actionable answers.
The point isn’t to collect all the data. It’s to collect the right data, in the right structure, to understand real-world behavior.
Determining who observability is for
Observability isn’t just for site reliability engineers. It helps everyone, including:
» Developers, who use it to see how new code behaves in production
» Platform teams, who use it to enforce consistency and spot regressions
» Product teams, who use it to understand feature adoption or API usage patterns
When done right, observability gives everyone the shared context they need to collaborate effectively, solve problems faster, and make better, data-informed decisions.
LOOKING INTO THE ROLE
OF PLATFORM ENGINEERS
While developers and product teams benefit from observability, platform engineers are often the ones who make it possible. They define the standards, build the pipelines, and ensure telemetry is collected in a way that works across services and teams.
This includes:
• Rolling out the OpenTelemetry SDKs and Collector
•
• Setting up sampling rules, telemetry filters, and data retention
• Providing shared dashboards or queries that developers can build on
6 OpenTelemetry For Dummies, Dash0 Special Edition These materials are © 2026 John Wiley & Sons, Inc. Any dissemination, distribution, or unauthorized use is strictly prohibited.
If developers are responsible for emitting useful telemetry, platform engineers are accountable for ensuring it flows smoothly, scales effectively, and remains useful.
Observability isn’t a sidecar; it’s part of the platform. Treat it like code, version it, and give teams the guardrails to do it right.
Seeing Signals, Context, and Correlation Observability is like being a detective. You need clues from different sources, as shown in Figure 1-2, including:
» Metrics: Numeric measurements that capture trends over time.
» Logs: The text-based event records developers are most familiar with.
» Traces: Capture the journey of a single request as it flows across systems.
» Profiles: Show you where your code is spending its time.
» Real User Monitoring (RUM): Captures how real users experience your application, such as page load time, frontend errors, and navigation behavior.
FIGURE 1-2: Visualizing the signals.
Each signal gives a different perspective on your system, from its internal workings to the user’s experience. When they work together, you get a clear and understandable narrative.
Discovering why context is everything
The truth is that telemetry without context is just data. Collecting tons of data is easy. Making sense of it? Not so much.
CHAPTER 1 Understanding Observability 7
These materials are © 2026 John Wiley & Sons, Inc. Any dissemination, distribution, or unauthorized use is strictly prohibited.
You need context — the “who, what, where, and when” behind each log, metric, or trace. For example, you need to know:
» Which service emitted this log?
» What request was it part of?
» Which user was impacted?
Without context, you have a mountain of numbers and text. With context, you’re able to automatically link a high-level symptom, like a metric alert, directly to the specific signals that reveal its root cause across every service involved.
Knowing why you can’t duct tape
this together
Getting this level of correlation isn’t something you can brute-force after the fact. You need your entire system to speak the same language with:
» Consistent attribute names across signals
» Standardized units and dimensions in your metrics
» Shared IDs that link logs, metrics, and traces
» Propagation of shared context across service boundaries Without this foundation, your telemetry is just a stream of expensive, disconnected data that obscures problems rather than revealing them.
This is where OpenTelemetry comes in. This open standard provides the universal toolkit to finally break down data silos and build a truly observable system from the ground up.
Modern systems generate a staggering amount of telemetry, but piling up more data without context just creates noise and is expensive. The goal is to collect the right clues, enriched with the right context, so you can quickly find actionable answers when it matters most.
8 OpenTelemetry For Dummies, Dash0 Special Edition These materials are © 2026 John Wiley & Sons, Inc. Any dissemination, distribution, or unauthorized use is strictly prohibited.

IN THIS CHAPTER
» Understanding what OpenTelemetry
is and isn’t
» Appreciating why OpenTelemetry-native observability is the future
» Seeing how OpenTelemetry standardizes telemetry across your stack
» Exploring the key components of the
OpenTelemetry project
Chapter 2
Meeting OpenTelemetry
Before OpenTelemetry, collecting telemetry data was chaotic.
Every vendor used a proprietary format and each team had its own conventions. You’d find JSON logs here, YAML configs there, and metrics that meant different things depending on who wrote them.
It was like building a puzzle where none of the pieces fit. Dashboards didn’t line up, alerts fired for no clear reason, and every new service meant writing new code just to get basic telemetry.
OpenTelemetry was created to address this issue by providing a unified approach for collecting, processing, and transmitting observability data .
Why OpenTelemetry and
Standardization Matter
Imagine trying to build a house where each wall is measured in a different unit, where each screw is labeled with a different spec, and no one agrees on which way is up. That’s what most observability systems looked like before OpenTelemetry: a collection of mismatched data that was nearly impossible to correlate.
CHAPTER 2 Meeting OpenTelemetry 9
These materials are © 2026 John Wiley & Sons, Inc. Any dissemination, distribution, or unauthorized use is strictly prohibited.
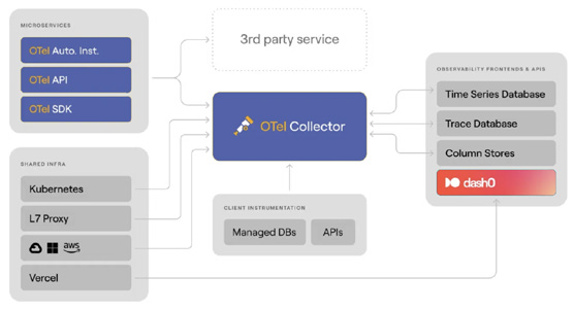
OpenTelemetry solves this by standardizing how telemetry data is generated, structured, and sent, as shown in Figure 2-1. It gives you:
» A shared data model for logs, metrics, traces, and (soon) profiles and real user monitoring
» Standard names for telemetry attributes, so everyone speaks the same language
» Ready-to-go libraries for popular programming languages
» A unified protocol to send your data to whatever tools you want to use
» A Collector to receive, process, and forward telemetry You can think of OpenTelemetry as the plumbing and faucet of observability. Its main job is to ensure clean, standardized data flows from every part of your system so it can be reliably correlated and used to solve even unanticipated problems.
FIGURE 2-1: A bird’s-eye view of OpenTelemetry.
This is achieved by having every service emit signals using a common schema, governed by a shared dictionary for how all telemetry is structured and labeled. This universal standard ensures every signal is structured and labeled in a consistent way which is what makes seamless correlation automatic.
10 OpenTelemetry For Dummies, Dash0 Special Edition These materials are © 2026 John Wiley & Sons, Inc. Any dissemination, distribution, or unauthorized use is strictly prohibited.
Because of this consistency, dashboards don’t break, alerts become more reliable, and you can instantly link a spike in latency (metrics) to a specific error (logs) and the end-to-end request that caused it (traces).
You collect structured data once and can send it to any tool you like for analysis and alerting.
OpenTelemetry is now supported by every major observability platform, from open-source tools to enterprise vendors, making it one of the most widely adopted standards in the space.
Dipping into the Core Components
of OpenTelemetry
Let’s take a closer look at what OpenTelemetry includes:
» SDKs and APIs: Each supported language — Go, Java,
.NET, Python, JavaScript, and more — has its own software development kit (SDK). These SDKs expose application programming interfaces (APIs) to create spans, record metrics, or emit logs according to the OpenTelemetry data model for each signal. Most frameworks also support auto-instrumentation, so you can start collecting traces, metrics, and logs with little or no code changes.
» Semantic conventions: These are simply rules for naming things. Instead of everyone inventing their own field names, OpenTelemetry provides an agreed-upon dictionary. These conventions are versioned, documented, and enforced across SDKs and signals. When your data follows these rules, your observability tools can organize, filter, and correlate it much more easily.
» OpenTelemetry Protocol (OTLP): This is the protocol used to format and move telemetry data around. It works with gRPC
or HTTP and can carry logs, metrics, and traces together.
Because OTLP is open and widely adopted, you aren’t locked into any one vendor. Many commercial and open-source observability platforms support receiving OTLP data directly.
CHAPTER 2 Meeting OpenTelemetry 11
These materials are © 2026 John Wiley & Sons, Inc. Any dissemination, distribution, or unauthorized use is strictly prohibited.
» The Collector: This is a standalone service that receives telemetry, processes it, and exports it to one or more backends. You can enrich signals, remove sensitive data, sample traces, or drop low-priority logs, all without touching application code. It’s the operational engine that makes OpenTelemetry flexible, scalable, and production-ready.
At the core of the Collector is a simple but powerful pipeline model made up of three key stages:
• Receivers bring telemetry into the pipeline. They support OTLP, Jaeger, Prometheus, FluentBit, and many other formats. This is how data gets in, whether from your apps, agents, or cloud integrations.
• Processors apply logic to that data. You can batch, sample, redact, or enrich it. Want to add region labels?
Remove user tokens? Drop debug-level logs? Processors are where that happens.
• Exporters send the processed data to one or more backends such as Dash0, Prometheus, OpenSearch, or any system that understands OTLP, logs, or metrics. You can send the same data to multiple places at once.
THE OPENTELEMETRY DEMO
The OpenTelemetry Demo is a ready-made e-commerce app with built-in telemetry and a working Collector pipeline. It’s a great way to:
• See how OpenTelemetry collects data from services
• Watch traces flow through the Collector
• Explore dashboards and trace views
• Understand how it all fits together without instrumenting your own app yet
. It’s a great way to see OpenTelemetry in action, even if you haven’t instrumented your app yet.
12 OpenTelemetry For Dummies, Dash0 Special Edition These materials are © 2026 John Wiley & Sons, Inc. Any dissemination, distribution, or unauthorized use is strictly prohibited.
For getting started with the OpenTelemetry Collector, we recommend the contrib distribution. It’s the most comprehensive version, providing the widest range of capabilities for connecting to various sources and destinations.
Do you need help understanding how Collector components fit together? a free, open-source visual editor that helps you build and validate Collector configurations.
Uncovering the Meaning of
OpenTelemetry-Native
Some vendors say they support OpenTelemetry because they can ingest OTLP data. That’s a good first step, but a common reality is that observability tools simply ingest OpenTelemetry data without deeply understanding it.
OpenTelemetry-native means being built around OpenTelemetry’s core principles of signal correlation and standardized context, and leveraging this foundation to solve critical challenges.
In contrast, a non-native tool is an existing system that has been adapted to accept OpenTelemetry data, often by converting it into its own proprietary format, which can result in a loss of context and features.
Table 2-1 highlights some of the key differences that distinguish an OpenTelemetry-native tool from one that merely “supports”
OpenTelemetry:
In an OpenTelemetry-native world, everything just works. Your logs, metrics, and traces link up automatically because everything follows the same rules from the start.
Supporting OTLP is a checkbox. Being OpenTelemetry-native is a commitment. Look for tools that treat OpenTelemetry as the foundation, not just another input.
CHAPTER 2 Meeting OpenTelemetry 13
These materials are © 2026 John Wiley & Sons, Inc. Any dissemination, distribution, or unauthorized use is strictly prohibited.
TABLE 2-1 Key Differences Between OpenTelemetry-native and Simple “Support”
“Supports”
Feature
OpenTelemetry-native
OpenTelemetry
Core design
Fundamentally designed with
Existing proprietary data
OpenTelemetry as the core data
models are adapted to
model and architecture.
ingest OpenTelemetry
data, often requiring
conversion and loss of
semantic information in
the process.
Data handling
All telemetry signals are fully
Telemetry signals are
integrated and correlated by
often treated as separate
design.
data silos with less
seamless correlation.
Context &
Fully leverages OpenTelemetry’s
The conversion process
metadata
semantic conventions and
may strip away or alter
resource context to link signals
important metadata,
and provide rich, actionable
leading to a loss of
insights.
context.
Querying
Offers a unified query language
Often requires different
across all signals.
query languages or
interfaces for different
data types.
User experience
Provides intuitive, resource-
UI may not consistently
centric views that align with a
reflect OpenTelemetry
user’s mental model of their
concepts (for example,
system.
calling attributes “tags”).
Data control
Offers advanced, built-in
Provides more basic data
sampling and data control
control, typically requiring
mechanisms that understand the
manual fine-tuning and
relationships between signals.
lacking integrated signal
awareness.
Ecosystem
Seamlessly interoperates with
Integration is possible but
integration
other cloud-native tools like
may be less efficient or
Prometheus and Kubernetes.
require additional
configuration.
Troubleshooting
Allows users to view the raw,
Raw OTLP data is typically
unprocessed OTLP data, which is
not available, as it has
useful for debugging
been converted to an
instrumentation issues.
internal format.
14 OpenTelemetry For Dummies, Dash0 Special Edition These materials are © 2026 John Wiley & Sons, Inc. Any dissemination, distribution, or unauthorized use is strictly prohibited.
Seeing why platform engineers care A good observability experience depends on platform teams making OpenTelemetry work like infrastructure. They’re the ones who:
» Roll out and maintain the SDKs
» Configure and operate the Collector
» Enforce naming conventions and semantic schema versions
» Build telemetry pipelines as code
» Offer pre-instrumented libraries and boilerplate, SDK
wrappers, and pre-configured auto-instrumentations
» Validate telemetry quality across environments When platform teams build these good defaults, they empower developers with reliable observability “for free”, without requiring every engineer to become a telemetry expert.
Even small teams benefit. You don’t need a huge infrastructure team to take advantage of OpenTelemetry’s benefits.
Observing OpenTelemetry in the
real world
OpenTelemetry is already widely used across:
» Cloud providers
» Startups
» Enterprises
» Serverless applications
» Hybrid cloud environments
Whether you’re running Kubernetes, AWS Lambda, on-prem servers, or a mix of everything, OpenTelemetry helps you consistently collect telemetry data.
CHAPTER 2 Meeting OpenTelemetry 15
These materials are © 2026 John Wiley & Sons, Inc. Any dissemination, distribution, or unauthorized use is strictly prohibited.
OpenTelemetry is the new default for observability. It doesn’t care what tool you use, where you store your data, or what language you write in. It simply aims to provide a single, consistent standard for understanding your systems at any scale.
The future of observability is OpenTelemetry-native, where every signal is structured, correlated, and built on a shared foundation.
16 OpenTelemetry For Dummies, Dash0 Special Edition These materials are © 2026 John Wiley & Sons, Inc. Any dissemination, distribution, or unauthorized use is strictly prohibited.

IN THIS CHAPTER
» Discovering the role of logs, metrics, and traces
» Understanding how signals complement
each other
» Learning why structure matters more
than volume
» Avoiding pitfalls caused by missing
context and noisy telemetry
» Previewing emerging OpenTelemetry
signals
Chapter 3
Reading Observability
Signals
When something breaks in your system, your job is a bit like being a detective. You weren’t there when it happened, but you have clues. The problem is making sure those clues are
» Available
» Complete
» Easy to follow
To make a system observable, you use different signals as complementary perspectives to investigate a problem. No single signal tells the whole story. The goal is to move between these views seamlessly to get a complete picture.
CHAPTER 3 Reading Observability Signals 17
These materials are © 2026 John Wiley & Sons, Inc. Any dissemination, distribution, or unauthorized use is strictly prohibited.
In this chapter, we introduce the five key signals:
» Logs: Capture what happened
» Metrics: Show frequency and severity
» Traces: Reveal the flow of requests across services
» Profiles: Indicates where your code spends time
» Real User Monitoring (RUM): Captures how real users experience your application, including page load times, frontend errors, and navigation paths
Each signal is a piece of the observability puzzle; the key is correlating them to reveal the complete picture of what happened.
Reviewing How Signals Work Together
Table 3-1 provides a comprehensive overview of how signals work together before we delve into each characteristic.
Looking at logging
Logs are the most familiar signal to most developers. They’re like a diary your system keeps as it runs, and might show:
» “User signed up”
» “Payment succeeded”
» “Could not connect to database”
When something goes wrong, you often start by reading the logs to see what happened.
But there’s a problem.
In modern systems, you might have thousands or even mil-lions of log lines. And most of them look like random strings of text, such as
[FATAL] 2025-06-15 10:23:47 - Failed to
connect to DB
When your system breaks, scrolling through endless logs like this isn’t very helpful.
18 OpenTelemetry For Dummies, Dash0 Special Edition These materials are © 2026 John Wiley & Sons, Inc. Any dissemination, distribution, or unauthorized use is strictly prohibited.
TABLE 3-1 How Signals Work Together Characteristic
Logs
Metrics
Traces
Profiling
RUM
What it tells you
What
How often, how
What happened
Where time is
How users experience
happened
many
and in what order
spent
your system
Structure
Text or
Numeric time
Tree of spans with
Stack samples,
Frontend and browser
structured
series with labels
timing and
time-based
events + timing metadata
JSON
metadata
Volume
High (can be
Low (aggregated)
Medium to high
High (but sampled)
Medium (depends on
noisy)
(controlled by
sampling and retention)
sampling)
Cost
Moderate to
Low
Medium (depends
High (early
Medium
high
on sampling)
adoption phase)
Correlation
Trace ID,
Labels, resource
Context
TBD (not widely
Trace ID (shared with
resource
attributes, trace
propagation,
integrated yet)
backend), device/
attributes
ID
resource attributes
browser/resource
attributes
OpenTelemetry
Stable
Stable
Stable
Experimental
Experimental
maturity
Best use
Debugging,
Alerting, trends
Root cause,
Code optimization,
UX debugging, frontend
errors
performance flow
performance
errors, page load analysis
tuning
CHAPTER 3 Reading Observability Signals 19
These materials are © 2026 John Wiley & Sons, Inc. Any dissemination, distribution, or unauthorized use is strictly prohibited.
Good logs are structured like filling out a form instead of writing random notes. Structured logs organize information into labeled fields. Here’s that same log, but structured:
{
"timestamp": "2025-06-15T10:23:47Z",
"severity": "FATAL",
"message": "Failed to connect to DB"
}
While structuring your logs is non-negotiable for modern observability, structure alone doesn’t create a powerful signal. OpenTelemetry provides the two key ingredients that do: a consistent model for all logs and the rich attributes needed to provide context.
With OpenTelemetry, your structured logs automatically include:
» Resource attributes so you know which service and environment produced each log entry.
» Trace context to connect each log to the exact request or operation that generated it.
» Consistently named attributes using semantic conventions.
{
“resourceLogs”: [
{
“resource”: {
“attributes”: [{ “key”: “service.name”,
“value”: { “stringValue”: “checkout-service” }}]
},
“scopeLogs”: [
{
“logRecords”: [
{
“timeUnixNano”: “1749963827000000000”,
“observedTimeUnixNano”:
“1749963827000000000”,
“severityNumber”: 21,
“severityText”: “FATAL”,
20 OpenTelemetry For Dummies, Dash0 Special Edition These materials are © 2026 John Wiley & Sons, Inc. Any dissemination, distribution, or unauthorized use is strictly prohibited.
“body”: { “stringValue”: “Failed to connect to DB” },
“attributes”: [
{
“key”: “exception.stacktrace”,
“value”: { “stringValue”: “java.
net.ConnectException: Connection refused at com.
example.db.connect...” }
}
],
“traceId”: “a3c1f1e2b6c74c7d”,
“spanId”: “5b9d6f0c4a1d3e92”
}
]
}
]
}
]
}
The OTLP/JSON example shown here is a condensed version of an OpenTelemetry log record to highlight its key structural components. In practice, the actual wire format is far more verbose and includes a much richer set of attributes.
This level of detail is needed to provide deeper context for trou-bleshooting, but you typically don’t need to work with this raw format yourself. OpenTelemetry log bridges and SDKs handle the conversion for you automatically.
This added context makes your logs much more than searchable text. Now you can:
» See only the logs related to a specific user request (by trace ID)
» Filter logs by service, version, or environment to narrow your focus
» Jump directly from a log message to a full distributed trace that shows what the entire system was doing at that moment
» Identify which database was involved, what user was accessing it, and exactly where the failure occurred CHAPTER 3 Reading Observability Signals 21
These materials are © 2026 John Wiley & Sons, Inc. Any dissemination, distribution, or unauthorized use is strictly prohibited.
In modern distributed systems, correlating logs with traces and metrics is what transforms logs into true observability data.
OpenTelemetry provides a simple and consistent way to do this across your entire stack.
Structured logs without context still leave you guessing. To find answers fast, you must enrich them with trace context and attributes from OpenTelemetry. This becomes critical when debugging complex issues that span multiple services.
Exploring metrics
Metrics summarize your system’s behavior as numbers you can monitor over time:
» How many requests per second are coming in?
» What’s the average response time?
» How many payment failures are happening?
Logs provide granular detail on every event, metrics on the other hand are aggregated to show totals, patterns, and trends, giving you a high-level view of your system’s health.
A single metric is just one data point, like this measurement for a specific checkout request:
http.server.request.duration{http.request.
method=POST, http.route=/checkout} 0.385
Your observability tool can aggregate lots of these measurements into high-level insights, such as:
95% of checkouts complete in under 500ms
Error rate is 1%
Request volume spiked at 10:05 a.m.
Metrics power the dashboards and alerting systems that help you spot trouble early before customers start calling.
22 OpenTelemetry For Dummies, Dash0 Special Edition These materials are © 2026 John Wiley & Sons, Inc. Any dissemination, distribution, or unauthorized use is strictly prohibited.
Understanding OpenTelemetry metric instruments
An instrument is the specific tool used to record a measurement.
OpenTelemetry provides several types for metrics, all purpose-built for telemetry:
» Counter for counting events that only go up, such as user logins or requests served.
» UpDownCounter for tracking increments or decrements to a value, such as the number of concurrent connections.
» Gauge for taking a snapshot of the current value of something (like current memory usage) at a specific point in time.
» Histogram for measuring the statistical distribution of values, such as request latencies.
OpenTelemetry also offers asynchronous, or “observable” vari-ants for each instrument. Instead of being updated with every event, these instruments are checked for their current value at a periodic interval.
If you’re reporting request duration, use a histogram, not a counter or a gauge. Unless you’re operating at massive scale, regular histograms are just fine. Not all backends support exponential histograms yet, so check compatibility before adopting them.
THE OPENTELEMETRY AND
PROMETHEUS PUZZLE
If you use Prometheus, you might wonder how it fits with OpenTelemetry. The short answer: they’re not competing — they’re complementary.
Prometheus is a metrics database and scraper. It pulls metrics from
/metrics endpoints, stores them locally, and supports PromQL and alerting. OpenTelemetry is a framework for standardizing telemetry and sending it somewhere else for storage.
(continued)
CHAPTER 3 Reading Observability Signals 23
These materials are © 2026 John Wiley & Sons, Inc. Any dissemination, distribution, or unauthorized use is strictly prohibited.
(continued)
Key differences at a glance:
Feature
Prometheus
OpenTelemetry
Scope
Metrics-only
Metrics, logs, traces, and profiles
Pull versus Pulls (scrapes) Pushes data (but can also pull)
push
data
Storage
Is a storage
Is a forwarder, not a backend
backend
Prometheus and OpenTelemetry aren’t mutually exclusive: often they’re better together. By combining them, you’ll enrich your Prometheus metrics with the context from traces and logs, enabling you to break down data silos without replacing your existing tools.
Prometheus is flexible with metric names like latency_s or response_time,but it doesn’t enforce units. OpenTelemetry enforces a consistent standard like http.server.request.
duration with defined units which leads to consistent dashboards and alerting across services.
Here are three ways they can work together:
• Scrape existing endpoints: Already exposing /metrics? The OpenTelemetry Collector can scrape those just like Prometheus and correlate them with traces and logs.
• Push metrics to Prometheus: OpenTelemetry can also push metrics into Prometheus using the remote_write protocol.
Recent versions of Prometheus even support OTLP ingestion.
• Expose Prometheus format from OpenTelemetry SDKs: If you’re using OpenTelemetry SDKs, they can expose a Prometheus-style endpoint, so Prometheus keeps scraping like normal.
Prometheus and OpenTelemetry aren’t rivals. If you’re already using Prometheus, keep it. Use it for what it does best and let OpenTelemetry complement it by providing the semantic structure and cross-signal context that transforms your metrics into a fully integrated part of your observability strategy.
24 OpenTelemetry For Dummies, Dash0 Special Edition These materials are © 2026 John Wiley & Sons, Inc. Any dissemination, distribution, or unauthorized use is strictly prohibited.
Tracing to Follow the Journey Distributed tracing helps you answer one of the most important questions in modern software systems: What happened to this request?
In a world of microservices, APIs, cloud functions, and queue-based systems, it’s not enough to know that something failed —
you need to know where, when, and why.
That’s where tracing comes in. It lets you track the full lifecycle of a request as it moves through your system, across services, threads, containers, or runtimes, from the browser to the database and back again.
A trace is the system’s narrative. It tells the story of a request, from start to finish.
Recognizing spans as building blocks
Each trace is made up of spans, as shown in Figure 3-1. A span represents one operation in a trace, like a function call or an out-bound HTTP request.
FIGURE 3-1: A span represents one operation in a trace.
Each span includes:
» A name (for example, GET/checkout)
» A start and end time
» Attributes like http.request.method, http.route, db.system CHAPTER 3 Reading Observability Signals 25
These materials are © 2026 John Wiley & Sons, Inc. Any dissemination, distribution, or unauthorized use is strictly prohibited.
» Context identifiers: trace_id, span_id, parent_span_id
» Optionally, events and status codes These spans connect to form a tree — the trace — which reflects the call path of your request.
Binding spans together with
context propagation
Spans are the building blocks, but context propagation is the glue that connects them across services. Think of it like a package moving through shipping centers. Each time it changes hands, the tracking number stays attached. That is how you keep the full journey linked.
OpenTelemetry handles this through headers (like traceparent) that travel with HTTP, gRPC, messaging protocols, and more.
Each service extracts the incoming context and links its own spans accordingly, as shown in Figure 3-2.
FIGURE 3-2: Traces connect one span to the next.
Without propagation:
» Traces break between services
» You lose end-to-end visibility
» Your waterfall becomes a flat list of spans If a trace only shows the first service, the trace context was likely dropped so check your context propagation.
26 OpenTelemetry For Dummies, Dash0 Special Edition These materials are © 2026 John Wiley & Sons, Inc. Any dissemination, distribution, or unauthorized use is strictly prohibited.
Always rely on the official OpenTelemetry SDKs and auto-instrumentation to handle context propagation. They correctly implement the necessary protocols (such as W3C trace context) out of the box.
Tracing without breaking the bank
Storing every trace from a high-traffic system can be prohibi-tively expensive. To manage this cost, OpenTelemetry supports sampling — deciding which traces to keep and which to drop. The two main strategies are:
» Head-based sampling: The decision to keep or drop a trace is made at the start of the request, before any work is done.
It’s simple and fast, but you might miss interesting traces (such as errors) if they weren’t flagged at the beginning (see Figure 3-3).
» Tail-based sampling: The decision is made after the full trace is collected. This lets you keep only the important traces, such as slow requests or those with errors. It gives you more control, and can be very tricky to set up correctly, especially for traces that take longer than a minute or so.
FIGURE 3-3: Head and tail-based sampling.
CHAPTER 3 Reading Observability Signals 27
These materials are © 2026 John Wiley & Sons, Inc. Any dissemination, distribution, or unauthorized use is strictly prohibited.
Most OpenTelemetry SDKs use head-based sampling by default.
Tail-based sampling is more powerful but needs a supporting backend or Collector pipeline.
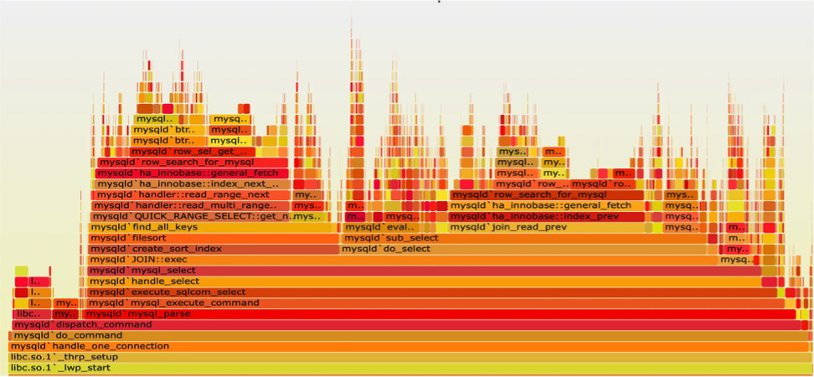
Profiling as the Emerging Fourth Signal While still experimental, OpenTelemetry has begun defining a profiling signal to capture CPU usage and execution time across stack frames.
Where traces tell you what happened, profiles show you where time was spent, down to the line of code.
Expect profiling (shown in Figure 3-4) to become more integrated over time, especially for:
» Identifying performance bottlenecks
» Comparing changes across releases
» Understanding cost hotspots in compute-heavy apps FIGURE 3-4: Profiling can be a helpful signal.
Profiling is still in flux. Try it out in your development environment, but don’t ship it to production just yet.
28 OpenTelemetry For Dummies, Dash0 Special Edition These materials are © 2026 John Wiley & Sons, Inc. Any dissemination, distribution, or unauthorized use is strictly prohibited.
Monitoring From the User’s Eyes Observability doesn’t start at the first backend API. Real User Monitoring (RUM) enables you to observe how actual users experience your system.
While backend telemetry tells you how services behave, RUM
shows how long users wait for pages to load, whether frontend errors occur, and which actions lead to failures.
RUM focuses on things like:
» Page load and interaction timing
» JavaScript errors in the browser
» Navigation events and route changes
» Device, browser, and region metadata It’s like tracing, but from the user’s device.
OpenTelemetry has started supporting RUM through its JavaScript SDKs. Although still marked as experimental, RUM instrumentation is already being used in production by teams adopting OpenTelemetry in browsers or mobile apps.
This means you can:
» Trace a user’s journey from click to backend processing
» Correlate frontend latency with backend spans
» Understand what users actually see, not just what your services report
With RUM, your traces don’t start at the load balancer. They start when the user taps, clicks, or swipes.
Real User Monitoring is the missing perspective in most observability setups. OpenTelemetry brings it into the same signal model so that you can connect frontend and backend behavior seamlessly.
CHAPTER 3 Reading Observability Signals 29
These materials are © 2026 John Wiley & Sons, Inc. Any dissemination, distribution, or unauthorized use is strictly prohibited.
Driving strategy through your
architecture
The telemetry signals you’ll collect vary depending on which layer of the infrastructure stack you are observing (Figure 3-5).
FIGURE 3-5: An OpenTelemetry-native observability tool lets you jump between signals seamlessly.
Lower levels provide more infrastructure-centric signals, while higher levels focus more on application and user behavior.
The ultimate goal is not just to collect these signals in isolation, but to connect them.
When traces carry rich context like trace_id, span_id,
nd
can be attached to logs, metrics, and even profiles. This is what enables powerful cross-signal correlation.
The most common pattern is logs ↔ spans, which allows you to jump from a log message straight into the trace that triggered it, or vice versa.
30 OpenTelemetry For Dummies, Dash0 Special Edition These materials are © 2026 John Wiley & Sons, Inc. Any dissemination, distribution, or unauthorized use is strictly prohibited.

But metrics can also share common attributes like http.route or
that let you pivot from an alerting spike directly into traces or filtered logs. Even profiling, as it matures in OpenTelemetry, will benefit from shared context, so you’ll be able to see not just what code ran slow, but which request and user it affected.
With this goal of correlation in mind, here’s a breakdown of the most common signals by infrastructure level, from the bottom up, as shown in Figure 3-6.
FIGURE 3-6: Your infrastructure choices directly influence which telemetry types will be most prevalent and useful for understanding your system’s behavior.
Bare metal, virtualization, and
operating systems
At the lowest levels of the stack, the prevalent telemetry types are primarily metrics and logs.
Here, metrics focus on hardware and OS-level performance, while logs record events like hardware failures, system errors, user logins, or process lifecycle events.
Runtimes, applications, and services
This is the layer where developers spend most of their time. It includes container orchestration (like Kubernetes), serverless platforms, and the applications and services themselves.
CHAPTER 3 Reading Observability Signals 31
These materials are © 2026 John Wiley & Sons, Inc. Any dissemination, distribution, or unauthorized use is strictly prohibited.
Metrics and logs are still crucial, but they become more application-focused such as RED metrics (Request, Duration, and Errors).
Tracing becomes a prevalent and critical signal at this level as it allows to see how a request flows through different services, containers, and functions.
Collecting profiling data is also most relevant here to enable targeted application code optimizations.
End-user devices and IoT
At the highest level of the stack are the end-user devices (browsers, mobile apps) and Internet of Things (IoT) devices where the focus here shifts entirely to the user experience.
This is where real user monitoring provides the missing perspective on what users actually experience by capturing metrics like page load times, interaction timings, and frontend errors.
Most importantly, RUM is where the end-to-end trace begins.
With OpenTelemetry, a trace doesn’t have to start at your load balancer; it can start the moment a user taps, clicks, or swipes, giving you a complete picture from the frontend all the way to the database and back.
Good observability isn’t about collecting signals separately; it’s about correlating them. Shared context is what enables you to move seamlessly from metric to trace to log with confidence.
Solving production issues through observability requires connecting different types of clues to understand the full story.
Traces, metrics, logs, and the emerging signals of profiling and RUM are those clues. Their power is unlocked not when they’re viewed in isolation, but when they’re correlated to pinpoint a root cause. OpenTelemetry provides the single, unified model to connect these signals, which is the key to solving problems faster.
Don’t try to pillar your way through observability. Signals aren’t pillars. They’re perspectives and they work best when they con-verge to tell a coherent story.
32 OpenTelemetry For Dummies, Dash0 Special Edition These materials are © 2026 John Wiley & Sons, Inc. Any dissemination, distribution, or unauthorized use is strictly prohibited.

IN THIS CHAPTER
» Understanding resource attributes and their importance
» Describing telemetry origin using
OpenTelemetry resources
» Applying best practices for consistent, meaningful context
» Preferring resource detectors over
manual setup
Chapter 4
Giving Telemetry
Context with Resources
OpenTelemetry collects various signals and correlates them to expose what’s really happening. But a stream of telemetry is only half the story without its origin: who produced it and in what environment.
In OpenTelemetry, this is the job of a Resource: a set of attributes that describe the entity producing the telemetry. This includes (but isn’t limited to):
» Service
» Host or container
» Cloud region
» Kubernetes pod
» Function-as-a-service (FaaS)
Without this context, telemetry is just noise: a stream of numbers and events with no meaning. With it, telemetry becomes a powerful map of your system.
CHAPTER 4 Giving Telemetry Context with Resources 33
These materials are © 2026 John Wiley & Sons, Inc. Any dissemination, distribution, or unauthorized use is strictly prohibited.
Telemetry without context is just data. OpenTelemetry without semantic conventions is going to wake you up at 2 a.m. because the development system is haunted. Again.
Defining a Resource in OpenTelemetry
In OpenTelemetry, every signal, whether it’s a span, a log, a metric data point, or a profile sample, is emitted with resource attributes attached. These are key-value pairs that describe the origin of that signal.
For example:
{
"cloud.provider": "gcp",
"cloud.region": "europe-west1",
}
These attributes aren’t added automatically unless you configure them. But they’re critical for filtering, correlation, alerting, and even cost control.
With consistent attributes, you can:
» Group telemetry by service
» Filter by environment
» Route data to different backends
» Debug production issues faster
Think of resource attributes as headers on an envelope. They inform the observability system where the data originated, and enable you to route, group, and understand it more easily.
34 OpenTelemetry For Dummies, Dash0 Special Edition These materials are © 2026 John Wiley & Sons, Inc. Any dissemination, distribution, or unauthorized use is strictly prohibited.
Exploring the anatomy of a good resource
What makes a resource “good”? In practice, it’s not just about adding a lot of attributes. It’s about being clear, consistent, and complete. Here are the big three:
» Give every service a recognizable name. This is the most important detail in your telemetry setup. Every service must define a name, otherwise, your observability data becomes ungrouped noise. Use clear, consistent naming patterns that work across environments and teams. In OpenTelemetry, this is done using the service.name resource attribute. Make it lowercase, stable, and aligned with your domain language.
Bad:
userservice-prod
prod_userservice_1234
Good:
Pair it with an explicit environment tag for full context.
» Know which environment you’re looking at. You don’t want your staging alerts waking someone up at 2 a.m. That’s why the environment context is non-negotiable.
Set the deployment.environment.name attribute to indicate whether telemetry came from development, staging, production, or other meaningful environment. This helps you route alerts, filter dashboards, and separate production insights from test data.
» Cloud, host, and container metadata. Attributes like cloud.provider, cloud.region, host.id, and container.name help tie your telemetry back to where it ran, even across clouds or on-prem environments.
These attributes power dashboards, filtering, and security controls. They’re especially helpful when comparing the same service across staging and production or between cloud regions.
CHAPTER 4 Giving Telemetry Context with Resources 35
These materials are © 2026 John Wiley & Sons, Inc. Any dissemination, distribution, or unauthorized use is strictly prohibited.
Setting resource attributes You have two main options: manual configuration or automatic resource detectors and sometimes you may want to mix both approaches.
» Option 1: Manual (via code or environment variables): This is the most basic method for setting resource attributes.
It works, but it’s brittle and easy to forget or misconfigure.
» Option 2: Resource Detectors (recommended): OpenTelemetry provides resource detectors for many environments, cloud providers, Kubernetes, FaaS platforms, and more. These detectors automatically discover the right attributes and apply them to your telemetry.
Examples include:
» gcp detector: adds cloud.provider, cloud.region, and so on.
» k8s detector: adds
and so on.
» host detector: adds host.id, os.type, and so on.
When you rely on automatic resource detection, you reduce the risk of missing or inconsistent attributes, and that keeps your data useful at scale.
Reviewing Resource Best Practices
Setting resource attributes isn’t hard, but doing it well takes dis-cipline. Here’s what experienced platform teams do:
» Always set service.name and deployment.environment.
name . These are the bare minimum. Make this mandatory in your instrumentation setup.
» Use resource detectors where possible. They work reliably, cover most environments, and ensure consistency across teams.
36 OpenTelemetry For Dummies, Dash0 Special Edition These materials are © 2026 John Wiley & Sons, Inc. Any dissemination, distribution, or unauthorized use is strictly prohibited.
» Don’t overload attributes. A good rule of thumb is that if a value is unique for every request, it does not belong in your resource attributes. It should only contain identifiers for the entity and environment producing telemetry.
» Version your resource schema. When possible, tie resource attributes to a versioned semantic convention (using the latest OTel schema versions, for example). That helps tools keep up with changes.
To ensure teams emit high-quality telemetry, provide them with a standard schema. Most errors come from missing or misused resource attributes.
Viewing Resource Attributes and
Correlation
One of the most powerful aspects of resource attributes is their ability to enable correlation across signals. When your logs, metrics, and traces all carry service.name, cloud.region, and deployment.environment.name, you can:
» Filter dashboards consistently
» Group metrics by deployment
» Search logs tied to a failing span
» Route telemetry to different tools or regions Without correlation, observability becomes fragmented. With it, you get a single, coherent view, even across complex distributed systems.
Resource attributes are not a small detail; they’re what transform isolated telemetry into actionable data and unlock the powerful filtering, correlation, and debugging needed to understand your systems.
CHAPTER 4 Giving Telemetry Context with Resources 37
These materials are © 2026 John Wiley & Sons, Inc. Any dissemination, distribution, or unauthorized use is strictly prohibited.

IN THIS CHAPTER
» Understanding manual, automatic,
and no-touch instrumentation
» Instrumenting a real Java and Node.js app with minimal effort
» Enriching telemetry with business
context and structured logs
» Getting started in other languages
and avoiding common pitfalls
Chapter 5
Seeing OpenTelemetry
in Action
OpenTelemetry might sound intimidating, but adding it to your application is often just a matter of configuration.
Whether you’re deploying in a containerized environment, working with a mature framework, or writing barebones code, you can get telemetry flowing with minimal effort.
This chapter guides you through three common approaches to instrumentation: manual setup, auto-instrumentation, and no-touch Kubernetes-based injection, using Java and Node.js as our primary examples.
If you’re working in Go, Python, .NET, and other languages, don’t worry. The core ideas of instrumenting your services with OpenTelemetry apply, even though the specific implementation details might differ.
CHAPTER 5 Seeing OpenTelemetry in Action 39
These materials are © 2026 John Wiley & Sons, Inc. Any dissemination, distribution, or unauthorized use is strictly prohibited.
Instrumenting Your Services with OpenTelemetry
The three primary ways to instrument your services with OpenTelemetry are:
» Auto-instrumentation: Attaching an agent that instruments libraries without code changes.
» Manual setup: Configuring the OpenTelemetry software development kit (SDK) directly in your code.
» No-touch (Kubernetes): Using the OpenTelemetry Operator (or other operators like the Dash0 Operator) to inject instrumentation at deployment time.
These methods aren’t mutually exclusive. You can start with one and evolve as your needs change. For example, many teams begin with auto-instrumentation, then layer in custom spans and metrics through manual SDK usage.
OpenTelemetry isn’t all-or-nothing. You can mix instrumentation types and switch between them as your system matures.
Reviewing the OpenTelemetry Todo App
This chapter uses a real demo application: a simple Todo app. It’s a microservices-based application with a todo-service that handles the creation and management of todos and a validation-service that checks if a todo’s name is valid.
The todo-service is created in Java, while the validation-service is created in Node.js, but the concepts and principles of OpenTelemetry demonstrated here are universally applicable.
For the most accurate, up-to-date guidance, consult the official language guides at .
You can find the demo application in this GitHub repository:
You’ll need to clone it to your computer using: 40 OpenTelemetry For Dummies, Dash0 Special Edition These materials are © 2026 John Wiley & Sons, Inc. Any dissemination, distribution, or unauthorized use is strictly prohibited.
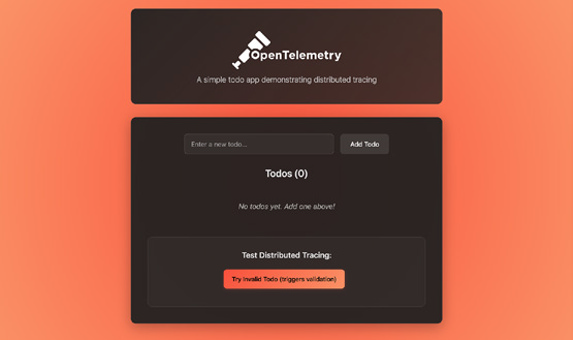
Once cloned, change into the opentelemetry-for-dummies directory and start the application (see Figure 5-1): docker compose up --build -d
FIGURE 5-1: The OpenTelemetry Todo App at http://localhost:3002.
The services will be created, and you’ll be able to access the appli-
You can add a few todo items to confirm its functionality. When an item contains the word “bad”, the validation will fail, and the todo will not be created, as shown in Figure 5-2.
You can see requests go in and responses come out, but you can’t observe what happens in between. How long did the database query take? Did the call to the validation service succeed or fail?
To answer these questions, you need to add instrumentation.
Starting with automatic
instrumentation
Auto-instrumentation is the fastest way to get started. It attaches an agent to your application that detects and instruments supported libraries, such as HTTP frameworks, databases, and message queues, without requiring any changes to your code.
CHAPTER 5 Seeing OpenTelemetry in Action 41
These materials are © 2026 John Wiley & Sons, Inc. Any dissemination, distribution, or unauthorized use is strictly prohibited.
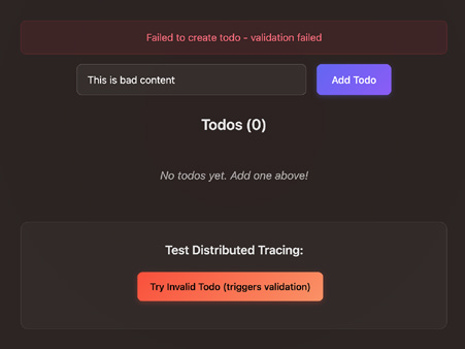
FIGURE 5-2: Todo items with the word ’bad’ intentionally trigger a validation failure.
For the todo-service, it’s as simple as starting your app with the OpenTelemetry Java Agent:
java -javaagent:opentelemetry-javaagent.jar
-jar <app>.jar
Likewise, for the validation-service, automatic instrumentation is achieved by loading the register script from auto-instrumentations-node package:
node --require @opentelemetry/auto-instrumentations-node/register index.js
Both services are already configured to install the required depen-dencies in their respective Dockerfiles.
In your docker-compose.yml file, uncomment the command field in the todo-service and validation-service as well as all the OTEL_* environment variables:
validation-service:
build: ./validation-service
ports:
- 3001:3001
42 OpenTelemetry For Dummies, Dash0 Special Edition These materials are © 2026 John Wiley & Sons, Inc. Any dissemination, distribution, or unauthorized use is strictly prohibited.
command: ["npm", "run", "start:otel"]
environment:
- OTEL_EXPORTER_OTLP_ENDPOINT=http://
otel-collector:4317
- OTEL_EXPORTER_OTLP_PROTOCOL=grpc
- OTEL_RESOURCE_ATTRIBUTES=service.
name=validation-service,service.version=1.0.0
depends_on:
- otel-collector
todo-service:
build: ./todo-service
ports:
- "3000:3000"
command: ["java", "-javaagent:opentelemetry-javaagent.jar", "-jar", "build/libs/
todo-java-0.0.1-SNAPSHOT.jar"]
depends_on:
mysql:
condition: service_healthy
validation-service:
condition: service_started
environment:
- SPRING_PROFILES_ACTIVE=docker
- SPRING_DATASOURCE_URL=jdbc:mysql://
mysql:3306/todo
- VALIDATION_SERVICE_URL=http://
validation-service:3001
- OTEL_EXPORTER_OTLP_ENDPOINT=http://
otel-collector:4317
- OTEL_EXPORTER_OTLP_PROTOCOL=grpc
- OTEL_RESOURCE_ATTRIBUTES=service.
name=todo-service,service.version=1.0.0
The OTEL_* environment variables allow you to configure the OpenTelemetry agent, telling it where to send telemetry data and how to identify it:
» OTEL_EXPORTER_OTLP_ENDPOINT: Specifies the address of the OpenTelemetry Collector (http://otel-collector:4317) where the agent will send its data.
CHAPTER 5 Seeing OpenTelemetry in Action 43
These materials are © 2026 John Wiley & Sons, Inc. Any dissemination, distribution, or unauthorized use is strictly prohibited.
» OTEL_EXPORTER_OTLP_PROTOCOL: Sets the communication protocol to gRPC, a high-performance method for sending telemetry.
» OTEL_RESOURCE_ATTRIBUTES: Adds resource attributes to your telemetry, like the required and service.version, for filtering and identifying your data in observability tools.
Here, we’re sending the data to the otel-collector service on port 4317. This service runs an OpenTelemetry Collector instance with the following pipeline for traces:
receivers:
otlp:
protocols:
grpc:
http:
processors:
batch:
exporters:
otlp/jaeger:
endpoint: jaeger:4317
tls:
insecure: true
service:
extensions: [basicauth/client]
pipelines:
traces:
receivers: [otlp]
processors: [batch]
exporters: [otlp/jaeger]
This configuration does the following:
» receivers: It’s configured to receive OpenTelemetry data over gRPC (port 4317) and HTTP (port 4318).
44 OpenTelemetry For Dummies, Dash0 Special Edition These materials are © 2026 John Wiley & Sons, Inc. Any dissemination, distribution, or unauthorized use is strictly prohibited.
» processors: The batch processor helps to batch up the data before sending it to the exporter.
» exporters: It registers Jaeger endpoint for exporting trace data.
» service: This section configures the pipeline for each signal, connecting the receiver, processor, and exporter.
To see it in action, rebuild and restart the todo-service and validation-service with:
docker compose up –-build -d todo-service
validation-service
With everything running again, you can now interact with the application. When you create a new todo with the name “This is a bad todo” the validation-service will reject it, and you’ll see an error as before.
Now, you can go to Jaeger UI at http://localhost:16686 to inspect the traces produced by the services, as shown in Figure 5-3.
FIGURE 5-3: Inspecting traces for the todo-service in Jaeger.
You’ll see a trace that shows the request going from the todo-service to the validation-service, and you’ll be able to see the error, as shown in Figure 5-4.
For successful todos, the trace becomes even more detailed, now including spans for the database transactions, as you can see in Figure 5-5. You’ll see the precise timings for each service involved in handling the request, all the way down to the final database commit. Remarkably, you get this deep visibility without having to write a single line of code in your service.
CHAPTER 5 Seeing OpenTelemetry in Action 45
These materials are © 2026 John Wiley & Sons, Inc. Any dissemination, distribution, or unauthorized use is strictly prohibited.
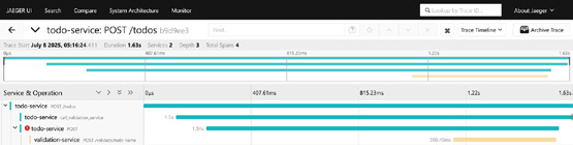
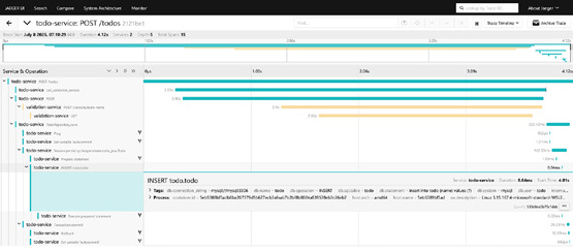
FIGURE 5-4: Tracing shows exactly where the error occurred in the request.
FIGURE 5-5: A complete trace showing every service and database interaction.
Always start with automatic instrumentation first. It provides a significant amount of value with minimal effort and sets a great baseline. You can always add more detailed manual spans later where they’re needed most.
Configuring manual instrumentation
While automatic instrumentation is great at showing you what’s happening at service boundaries, you’ll need more specific, business-relevant context to truly understand your application’s behavior.
This is where manual instrumentation comes in. It allows you to create custom spans and add attributes that reflect the unique logic of your application and provide insights that automatic instrumentation can’t capture on its own. A perfect example in the validation-service is the checkForBadWords method in the ValidationController. You can wrap this specific check in its own span to isolate its performance and outcome.
46 OpenTelemetry For Dummies, Dash0 Special Edition These materials are © 2026 John Wiley & Sons, Inc. Any dissemination, distribution, or unauthorized use is strictly prohibited.
const checkForBadWords = (todoName) => {
const span = tracer.startSpan("check_
bad_words", {
});
const lowerName = todoName.toLowerCase();
const hasBadWords =
lowerName.includes("bad") ||
lowerName.includes("terrible") ||
lowerName.includes("awful");
span.setAttribute("bad_words.found", hasBadWords);
span.addEvent("Bad words check completed"); if (hasBadWords) {
span.setStatus({
code: SpanStatusCode.ERROR,
message: "Todo name contains
inappropriate content",
}); }
span.end();
return hasBadWords;
};
Here’s what this manual instrumentation accomplishes. It: 1. Creates a focused span: A new span named check_bad_
words is created, isolating this specific piece of business logic in the trace.
2. Adds contextual attributes: It adds the todo.name and a bad_words.found boolean attribute to the span. This allows you to immediately see which input was being checked and what the outcome was.
CHAPTER 5 Seeing OpenTelemetry in Action 47
These materials are © 2026 John Wiley & Sons, Inc. Any dissemination, distribution, or unauthorized use is strictly prohibited.
3. Marks the span as an error: When bad words are found, span.setStatus(SpanStatusCode.ERROR,...) is called.
This is crucial as it visually flags the span as an error in observability backends and makes it easy to spot failures at a glance.
4. Ensures span completion: The span.end() call is necessary to complete the span and to prevent resource leaks.
This manual instrumentation relies on an initialized OpenTelemetry SDK to function. Conveniently, the automatic instrumentation agent handles this initialization for you.
If no SDK is configured, the OpenTelemetry API defaults to a no-op tracer, which is a “do nothing” implementation. This ensures your manual tracing calls don’t cause errors, but it also means no span data will be recorded.
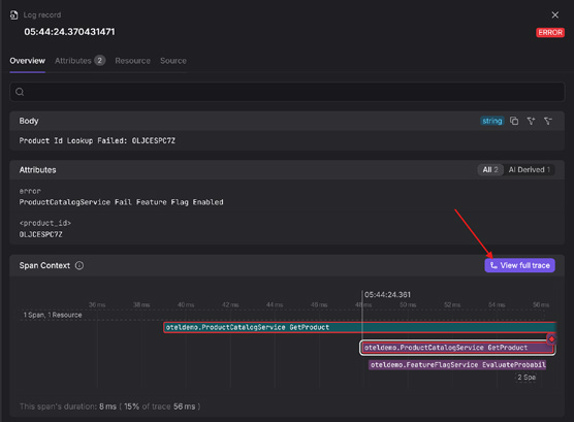
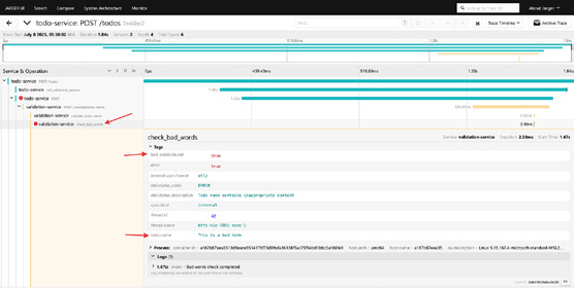
After making this change, rebuild the validation-service, and then create a new todo item containing a bad word. In Jaeger, you’ll see that the check_bad_words span is created, and it contains the relevant contextual details about the operation (Figure 5-6).
docker compose up –-build -d todo-service
FIGURE 5-6: The specific check that failed is now clearly highlighted in Jaeger.
You’ve now transformed a generic trace into an actionable diag-nostic tool. When a request fails validation, you can immediately 48 OpenTelemetry For Dummies, Dash0 Special Edition These materials are © 2026 John Wiley & Sons, Inc. Any dissemination, distribution, or unauthorized use is strictly prohibited.
see not only that it failed, but also precisely which check failed, why it failed (with the specific content), and have it clearly marked as an error.
If your traces aren’t showing up after adding manual instrumentation, the first thing to check is how you’re getting your Tracer. Ensure that the OpenTelemetry SDK was initialized first; otherwise, you might be getting a no-op tracer that doesn’t do anything.
Logging with OpenTelemetry
Most applications already have a logging system in place. With OpenTelemetry, you don’t need to throw that away. You can use a log bridge to route your structured logs through OpenTelemetry, where they’re enriched with trace context and forwarded to your backend.
In Node.js, the auto-instrumentations-node package already handles that for you as it includes a bridge for popular logging libraries like Winston and Pino.
With that in place, logs that happen during a trace will be associated with that trace. You can see an example of this in your validation-service logs where the “checking for bad words”
entry is enriched with the span_id and trace_id:
{
"level": "info",
"message": "checking for bad words",
"span_id": "7f113c2ee9953c5c",
"timestamp": "2025-07-10T09:01:52.291Z",
"trace_flags": "01",
"trace_id": "00dbd734a5b0d9723ca61bc316b49dbc"
}
This makes it possible to see an interesting log and then immediately jump to the trace that produced it to see the full context of the request (Figure 5-7). Alternatively, you can inspect a slow or failed trace and instantly view all the relevant logs from every service involved in that transaction.
CHAPTER 5 Seeing OpenTelemetry in Action 49
These materials are © 2026 John Wiley & Sons, Inc. Any dissemination, distribution, or unauthorized use is strictly prohibited.
FIGURE 5-7: An OpenTelemetry-native tool lets you see all the logs associated with a span in the same view.
Log bridges make your logs part of your distributed trace — no more switching tabs or grepping for request IDs.
Implementing No-Touch Instrumentation
in Kubernetes
If you’re running in Kubernetes, the OpenTelemetry Operator offers a fully automated experience. It injects the OpenTelemetry agent into your pods based on annotations — no image changes or redeploy scripts required.
To use it, you can create an Instrumentation resource: apiVersion: opentelemetry.io/v1alpha1
kind: Instrumentation
metadata:
name: instrumentation
namespace: opentelemetry
spec:
exporter:
endpoint: http://otel-collector:4317
propagators:
- tracecontext
- baggage
sampler:
type: always_on
resource:
addK8sUIDAttributes: true
50 OpenTelemetry For Dummies, Dash0 Special Edition These materials are © 2026 John Wiley & Sons, Inc. Any dissemination, distribution, or unauthorized use is strictly prohibited.
Then, you annotate your deployment. For example, here’s the annotation for the todo-service:
metadata:
annotations:
instrumentation.opentelemetry.io/inject-java:
"opentelemetry/instrumentation"
That’s it. The Operator automatically adds the Java agent, applies the correct flags, and manages context propagation. This approach is particularly powerful for platform teams who want to enforce observability standards without burdening developers.
No-touch instrumentation requires no changes to your application code or container image — it’s fully managed via Kubernetes configuration.
Avoid sending telemetry to dedicated, siloed systems for each signal. The true value is unlocked with a unified view that lets you treat traces, metrics, and logs not as separate pillars, but as con-verging perspectives of your systems.
The full code examples shown in this chapter, including both services and Collector configuration, are available
CHAPTER 5 Seeing OpenTelemetry in Action 51
These materials are © 2026 John Wiley & Sons, Inc. Any dissemination, distribution, or unauthorized use is strictly prohibited.

IN THIS CHAPTER
» Spotting what good and bad
telemetry look like
» Understanding why volume makes
observability harder, not better
» Turning chaos to clarity with the
SIFT framework
» Taming noisy telemetry at scale
Chapter 6
Scaling and Improving
Telemetry
If you’ve been reading sequentially, you now know how to emit well-structured telemetry signals using OpenTelemetry and context-rich attributes. But as your systems grow, so does your telemetry.
You might have:
» Dozens of services
» A multi-cloud environment
» CI/CD pipelines deploy code every hour Even with OpenTelemetry, the volume can still be overwhelming (and costly) unless you’re intentional.
This chapter is about how to scale observability cleanly, using the same tools you already have, just more strategically. We show you how to stay ahead of the noise (and reduce costs) using the SIFT method and how OpenTelemetry helps you implement it from day one.
CHAPTER 6 Scaling and Improving Telemetry 53
These materials are © 2026 John Wiley & Sons, Inc. Any dissemination, distribution, or unauthorized use is strictly prohibited.
As your system scales, more telemetry often creates more expensive noise, not more clarity. To scale observability effectively, you must shift your focus from quantity to quality: collecting data that’s structured, contextual, and purposeful.
Determining What Makes Telemetry
Good or Bad
To ensure your telemetry is effective, it must be purposeful.
A common trap is emitting telemetry “just in case” without understanding what it means or what question it answers. If you can’t act on a signal, it’s not worth collecting it.
Good telemetry is designed around real questions, such as:
» How long does checkout take, and where’s the slowdown?
» How many errors do we see per endpoint?
» What’s the P95 latency by customer tier?
This approach helps you avoid the pitfalls of bad telemetry, which includes logs with inconsistent formats, meaningless trace names, or metrics with unbounded cardinality.
Good telemetry, by contrast, follows semantic conventions, contains high-cardinality attributes on spans and logs, propagates trace context, and can be linked across signals.
If your telemetry can’t tell what happened, where it happened, or why, it’s not observability. It’s noise.
Introducing the SIFT Methodology
At this point, you might be asking: “How do I get from messy, noisy telemetry to something actionable and cost-effective?”
That’s where the SIFT methodology comes in: a modern framework for managing observability pipelines at scale.
SIFT stands for:
» Spam filter what you don’t need
» Improve what remains with context 54 OpenTelemetry For Dummies, Dash0 Special Edition These materials are © 2026 John Wiley & Sons, Inc. Any dissemination, distribution, or unauthorized use is strictly prohibited.
» Filter and group to match user intent
» Triage quickly, with correlation and clarity Spam filtering – Dropping what
you don’t need
The first step in building a healthy telemetry pipeline is removing noise. Think of spam filtering as a gate. It determines what’s allowed before anything is stored, analyzed, or visualized.
Common spam patterns include:
» Logs that say nothing (“starting process,” “status ok”)
» Repetitive events during startup or shutdown
» Spans that wrap infrastructure libraries without custom names
» Metrics that are emitted every second with no variation OpenTelemetry gives you tools to automate this cleanup:
» The Collector can drop logs or spans based on content, attributes, or severity.
» OpenTelemetry Transformation Language (OTTL) can express complex logic: “Drop all logs from dev environments except errors.”
» Sampling lets you reduce trace volume before export.
Dropping noisy telemetry isn’t risky, it’s responsible. You’re not throwing away insight. You’re preventing noise from drown-ing it out.
Improve – Enriching signals
with context
Once you’ve removed junk, the next step is to improve what remains. That means adding context to every log line, span, and metric.
Why? Because context is what turns isolated data into actionable information.
CHAPTER 6 Scaling and Improving Telemetry 55
These materials are © 2026 John Wiley & Sons, Inc. Any dissemination, distribution, or unauthorized use is strictly prohibited.
You can:
» cloud.region, or deployment.environment.name
» Inject trace IDs into logs to connect them with traces
» Normalize span names to follow semantic patterns
» Version your schema to track consistency over time These improvements often happen inside the OpenTelemetry Collector using processors to enrich data before it hits storage.
Do add high-cardinality attributes like user.id or session.id to spans and logs. They’re essential for debugging specific requests and understanding user impact. Don’t add high-cardinality attributes to resource attributes or metric labels. This can overwhelm your observability backend, leading to high costs and system instability.
For example:
Original Log
Improved Log (with context)
“timeout
“timeout occurred” +
occurred”
auth-service
“failed to
“failed to connect” +
connect to DB“
=prod
If a signal doesn’t tell you where it came from, what it’s part of, or why it matters, it needs context.
Filter and group – Making it navigable
After you’ve dropped what you don’t need and improved what you kept, the next step is to make telemetry navigable. That means:
» Filtering out low-priority signals before they reach the user
» Grouping related signals by service, operation, or severity This isn’t about data loss. It’s about decluttering the view, so the right signals surface during triage or dashboarding.
56 OpenTelemetry For Dummies, Dash0 Special Edition These materials are © 2026 John Wiley & Sons, Inc. Any dissemination, distribution, or unauthorized use is strictly prohibited.
For example:
» Grouping logs by service.name and log.severity
» Filtering metrics by deployment.environment.name=prod
» Aggregating traces by http.route or rpc.method OpenTelemetry-native platforms often use predefined filters (for example, only showing traces from services with high error rates), and dynamic groupings (for example, logs from all services with cloud.provider=aws).
If your dashboard makes you squint, it’s time to group smarter.
Your telemetry should reflect your mental model, not the other way around.
Triage – The fastest path to insight
Finally, the point of all this is to enable triage: when something breaks, how quickly can you understand it?
Triage is about cutting through the noise, following a breadcrumb trail from:
A metric spike → To a correlated trace → To a meaningful log line You want to go from “alerts firing” to “problem understood” in seconds, not hours.
To enable this:
» Make sure logs include trace context
» Ensure metrics and traces share semantic labels
» Use the Collector to enrich and correlate data early
» Train teams to use query paths like:
“Give me all logs for span_id=X”
“Show me traces related to HTTP 5xx on service=checkout”
Triage isn’t a phase. It’s a loop. The faster your team can follow that loop, the shorter your incidents and the less stress your on-call engineers feel.
CHAPTER 6 Scaling and Improving Telemetry 57
These materials are © 2026 John Wiley & Sons, Inc. Any dissemination, distribution, or unauthorized use is strictly prohibited.
LOOKING AT AI, PATTERN
DETECTION, AND THE FUTURE
As telemetry volume grows, it’s no longer enough to browse logs or traces manually. AI-assisted tooling is starting to help with:
• Structuring logs from legacy systems
• Summarizing trace behavior anomalies
• Detecting outliers in system behavior These systems don’t replace engineers; they prioritize your attention.
Imagine a future where your observability platform tells you:
“This trace deviates from normal checkout behavior — P95 latency 3x expected”
That’s what modern, OpenTelemetry-native platforms are aiming for.
AI doesn’t create insight — it amplifies it. You still need good, structured, and correlated telemetry for AI to be effective at all.
Scaling observability isn’t about turning every knob up to 11. It’s about collecting the right data, giving it the right structure, and flowing it through pipelines that are smart by design.
OpenTelemetry helps make this a reality, with processors, OTTL, semantic conventions, and a scalable architecture. The more you treat telemetry like code, the more resilient and useful it becomes.
58 OpenTelemetry For Dummies, Dash0 Special Edition These materials are © 2026 John Wiley & Sons, Inc. Any dissemination, distribution, or unauthorized use is strictly prohibited.

IN THIS CHAPTER
» Scaling, sustaining, and improving
observability
» Emphasizing structure and context over collecting everything
» Reviewing the roles of developers and platform engineers
Chapter 7
Ten Practical Tips for
Managing Observability
Modern observability is more than just a powerful tool; it’s a practice that requires a strategic approach to be effective. This chapter distills the key lessons from this book into a set of practical tips.
Whether you’re just setting up your first trace or refining your production pipeline, these principles will help you focus on what truly matters: extracting clear, actionable signals from your systems.
Don’t Collect Everything
More data often means more noise. If your traces are 30 spans long and every span says “OK”, you’re wasting resources and mental energy.
Focus on collecting meaningful telemetry. Design your instrumentation around real questions you’ve asked during incidents.
Use semantic conventions. Drop junk early, and be deliberate about what you keep.
CHAPTER 7 Ten Practical Tips for Managing Observability 59
These materials are © 2026 John Wiley & Sons, Inc. Any dissemination, distribution, or unauthorized use is strictly prohibited.
If you wouldn’t page someone about it, maybe you don’t need to store it.
Good Defaults Beat Good Intentions
You can’t rely on every developer to manually capture telemetry.
In fact, most developers won’t be observability experts, and that’s perfectly okay. But with a good starting point and some help, they may do a good job of observability regardless. That’s where good defaults come in: preconfigured resource attributes, SDK
wrappers, auto-instrumentation profiles, and Collector pipelines.
Establish a shared set of conventions across teams. Validate incoming telemetry with schema checks. And make the right thing easy, so teams don’t need to become observability experts to get it right.
Build Feedback Loops for
Telemetry Quality
The quality of telemetry isn’t something you set and forget. It drifts. Teams change. Code evolves. Semantic versions get out of sync. Telemetry suffers from bitrot every bit like application code does.
Schedule periodic reviews of telemetry quality. Run complete-ness reports. Make it part of your platform maturity, not just a response to outages.
If you’re not treating your observability like a product, you’re not doing observability right.
Align Logs, Metrics, and Traces
Each signal tells a part of the story. But if you don’t align them, you’ll spend half your time bouncing between tabs.
Make sure your logs reference the trace context. Use consistent resource attributes. When you connect signals through context, not dashboards, root cause analysis becomes significantly faster.
60 OpenTelemetry For Dummies, Dash0 Special Edition These materials are © 2026 John Wiley & Sons, Inc. Any dissemination, distribution, or unauthorized use is strictly prohibited.
Filter at the Edge, Not Just the Backend Sending raw, unprocessed telemetry to your backend is inefficient and can balloon costs unnecessarily. A better approach is to treat your telemetry pipeline as a strategic control point, using the OpenTelemetry Collector to shape and refine data at the edge.
Use it to filter out low-value logs, ensure the cardinality in your metrics is worth it, sample traces to have good compromise between signal and cost, and even redact sensitive data before it’s sent to your backend.
The OpenTelemetry Transformation Language (OTTL) is a powerful tool for implementing this logic, enabling you to improve the quality of your telemetry early in the pipeline.
Encourage Developers to Own
Their Signals
Developers know their services best. If you give them the tools, they’ll emit telemetry that’s incredibly valuable and that no SDK
can collect by default.
Provide templates. Offer SDK wrappers. Highlight great examples of meaningful spans or metric attributes. Make good telemetry a mark of craft, not a chore.
Let Platform Engineers Define the
Paved Path
A great observability experience doesn’t happen organically.
It’s engineered. Platform teams define the paved path, which includes the approved Collector configuration, the shared semantic schema, and the default exporters and sampling rules. They strike a balance between flexibility and consistency, making it easy for developers to plug in without having to reinvent the wheel.
CHAPTER 7 Ten Practical Tips for Managing Observability 61
These materials are © 2026 John Wiley & Sons, Inc. Any dissemination, distribution, or unauthorized use is strictly prohibited.
Optimize for Decision-Making, Not Storage
The question to ask of any telemetry signal is, “What decision will this help us make?”
If you’re not using a log to investigate incidents, consider dropping it. If a metric hasn’t triggered an alert in six months, maybe it’s time to rethink it. Keep telemetry that helps you act.
Data is cheap. Signal is expensive. Protect your signal.
Treat Telemetry as Code
Use version control. Use CI checks. Use review processes. Your telemetry configuration (SDK setups, collector configurations, sampling rules, semantic conventions) is just as critical as your application code because when your code fails, your observability really shouldn’t. Treat it that way. Declare it. Version it. Deploy it repeatably.
Choose OpenTelemetry-Native
Wherever Possible
Modern observability requires consistency, correlation, and context — all of which OpenTelemetry was designed to deliver.
OpenTelemetry-native platforms don’t just ingest OpenTelemetry data. They treat the Collector as a linchpin. They understand semantic schema, trace context, and signal correlation by default. This approach unlocks faster triage, smarter alerts, cleaner pipelines, and portable instrumentation across vendors.
The future of observability isn’t built around proprietary agents and disconnected dashboards. It’s built on a shared, open foundation. Your telemetry is yours, and you should have freedom and ease to find the best tool to consume it.
62 OpenTelemetry For Dummies, Dash0 Special Edition These materials are © 2026 John Wiley & Sons, Inc. Any dissemination, distribution, or unauthorized use is strictly prohibited.
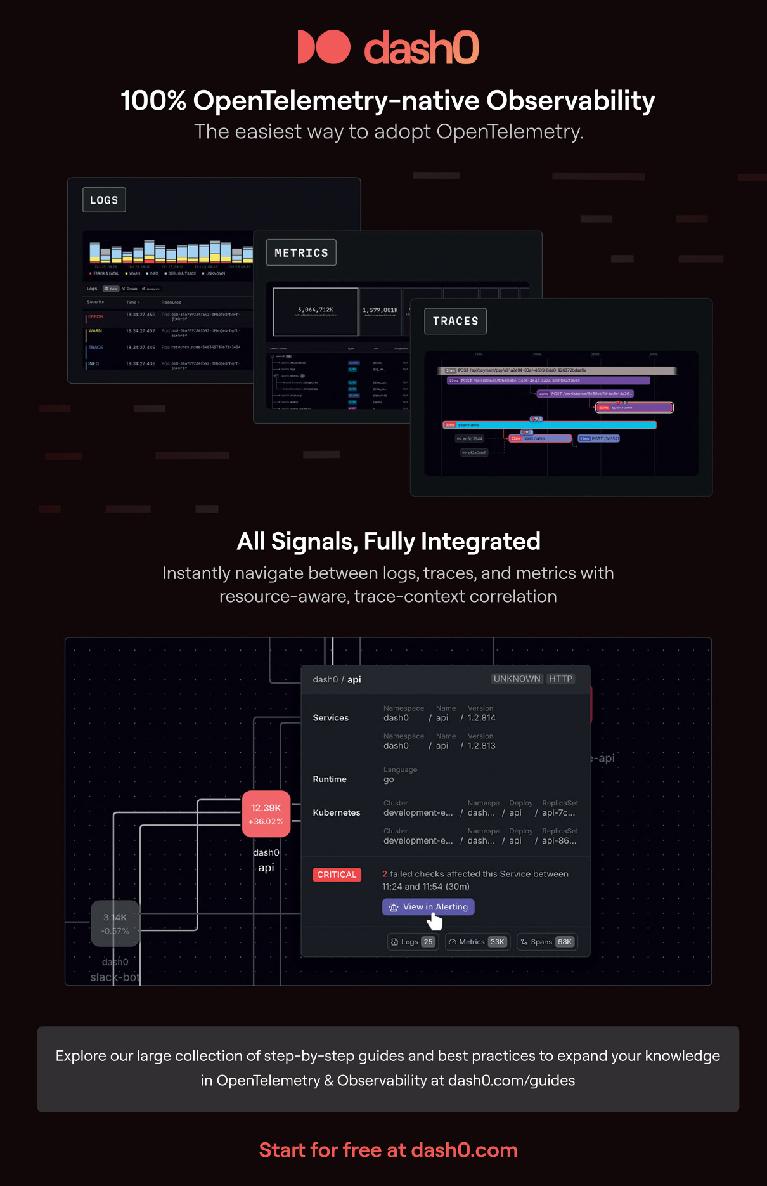
WILEY END USER LICENSE AGREEMENT
iley’s ebook EULA.

