
Power BI is a cloud-based analytics service that provides a unified view of the mission-critical business data. It’s Software as a Service (SaaS) offered by Microsoft in the reporting and visualization domain. It offers three basics components, which are:
- Power BI ( Online Service)
- Power BI Desktop
- Power BI Mobile
Here you will see the basics of Power BI and a critical feature termed as Natural Language Query. Before you understand each of these components separately, let’s have a look at the Architecture of Power BI. The architecture will explain how Power BI components are related to each other. If not, I am here to throw more light on it. Let’s understand the sequence as:
- Create Reports using Power BI Desktop (On-Premise) : Power BI desktop is a report authoring and designing tool that can be installed on your machine. You can use this tool to connect to more than 60 data sources and create a data model for further creating your reports.
- Publish Reports to Power BI online service (On-Cloud) : Once you create the reports, you need to show it to the world. But how? That’s where the Power BI online service comes into the picture. The reports created using Power BI desktop can be published to Power BI online ( ). For publishing the reports, you need to sign in to the online service using your official ID only.
- Consumer Reports on various devices : Once published, the reports can be shared with the world. The shared reports can be viewed on desktop browsers and even through the Power BI Mobile App.
Now, you have a fair idea about the Power BI architecture. Let us explore the three Power BI components separately.
Power BI helps you to stay informed about the progress of your business and keep you up to date with the business-critical information. With Power BI dashboards, you can keep an eye on the health of your business. The dashboards display the tiles that you can click to view the detailed reports for exploring more details. You can connect to multiple datasets to bring all the necessary data together in one place.
Did you notice the highlighted keywords in the above section? Yes, you are right; the Dashboard , Report, and Dataset are the major components of Power BI service. Let’s understand them in detail.
Dataset
A dataset is a collection of relevant data coming from a data source or multiple data sources. One dataset is also used to create multiple reports and dashboards.
Datasets can be created in two ways. It can be created by connecting to data sources using the Power BI Desktop tool. Alternatively, you can go to Power BI online and use the Get Data feature to connect to data sources for creating datasets.
Dataset is the most important building block for developing reports and dashboards. When you publish the reports Power BI Desktop to Power BI online service, the dataset also gets published to make reports intuitive and responsive.
Report
A report is a form of visualizing data into single or multiple pages like charts, graphs, trees, images, and pie charts. All these visualizations are created using a singular dataset. All the reports can be generated from scratch, or you can also import them with the help of dashboards shared among the team members. You can also import the reports when you connect to online third-party software such as Microsoft Excel, Salesforce, Power BI Desktop, content packages, and backend databases.
A report can be viewed and interacted in two different modes: Reading View and Editing View . The owners, co-owners, and users who are granted permission can view the reports in the Editing view. Others can view the reports in the form of a Reading view only; they can interact with reports but can’t modify them.
A report can only be created using a single dataset. However, it can be pinned to multiple dashboards.
Dashboard
The dashboard is a canvas than contains single or multiple tiles and widgets. These tile and widgets show the visualizations. And the visualizations are nothing but reports. So, the dashboards display reports and other components.
Dashboards can be created or shared by users among the group that has access to the shared content. Dashboards can also pin the reports coming from different sources like SSRS, Salesforce, etc.
Power BI Desktop is a report designing and authoring tool with advance data shaping and modeling capabilities that helps you to get your data ready for analysis in a short span of time.
Through Power BI Desktop, you can connect to more than 60 data sources and then make a data model using the Query Editor. Once the data model is built, you can develop your reports on it. After you create reports, you need to share them with peers. There are two ways the reports can be shared. One, the reports can be sent to peers in the form of a file with the extension .pbix, which is the default file extension for Power BI project files. Alternatively, you can publish your reports to Power BI online service and then share it with your peers. For sharing online, all your peers must have authorized access to the Power BI online service.
Power BI mobile is a very useful and important part of Power BI. If you want to keep track of your data while you're on the move, you can use one of Power BI's mobile applications for iOS, Android, and Windows devices. You can view all your reports, data, and all analytics on your mobile screen.
You need to install Power BI Mobile App on your mobile device or Tab. Once the app is installed, you can log in to the app using the credentials that you use for Power BI Online service. After logging in, the app takes you to the dashboards that were created by you or shared by your peers. This way, you are always connected to your business.
Power BI Mobile app allows you to set the alerts to notify you whenever there is a data modification at the source of data. This app is suitable for users who are always on the move.
You can open any of the dashboards by tapping on them. Within a dashboard, you can tap on a dashboard tile to focus on it in a larger view, as shown in the following figure.
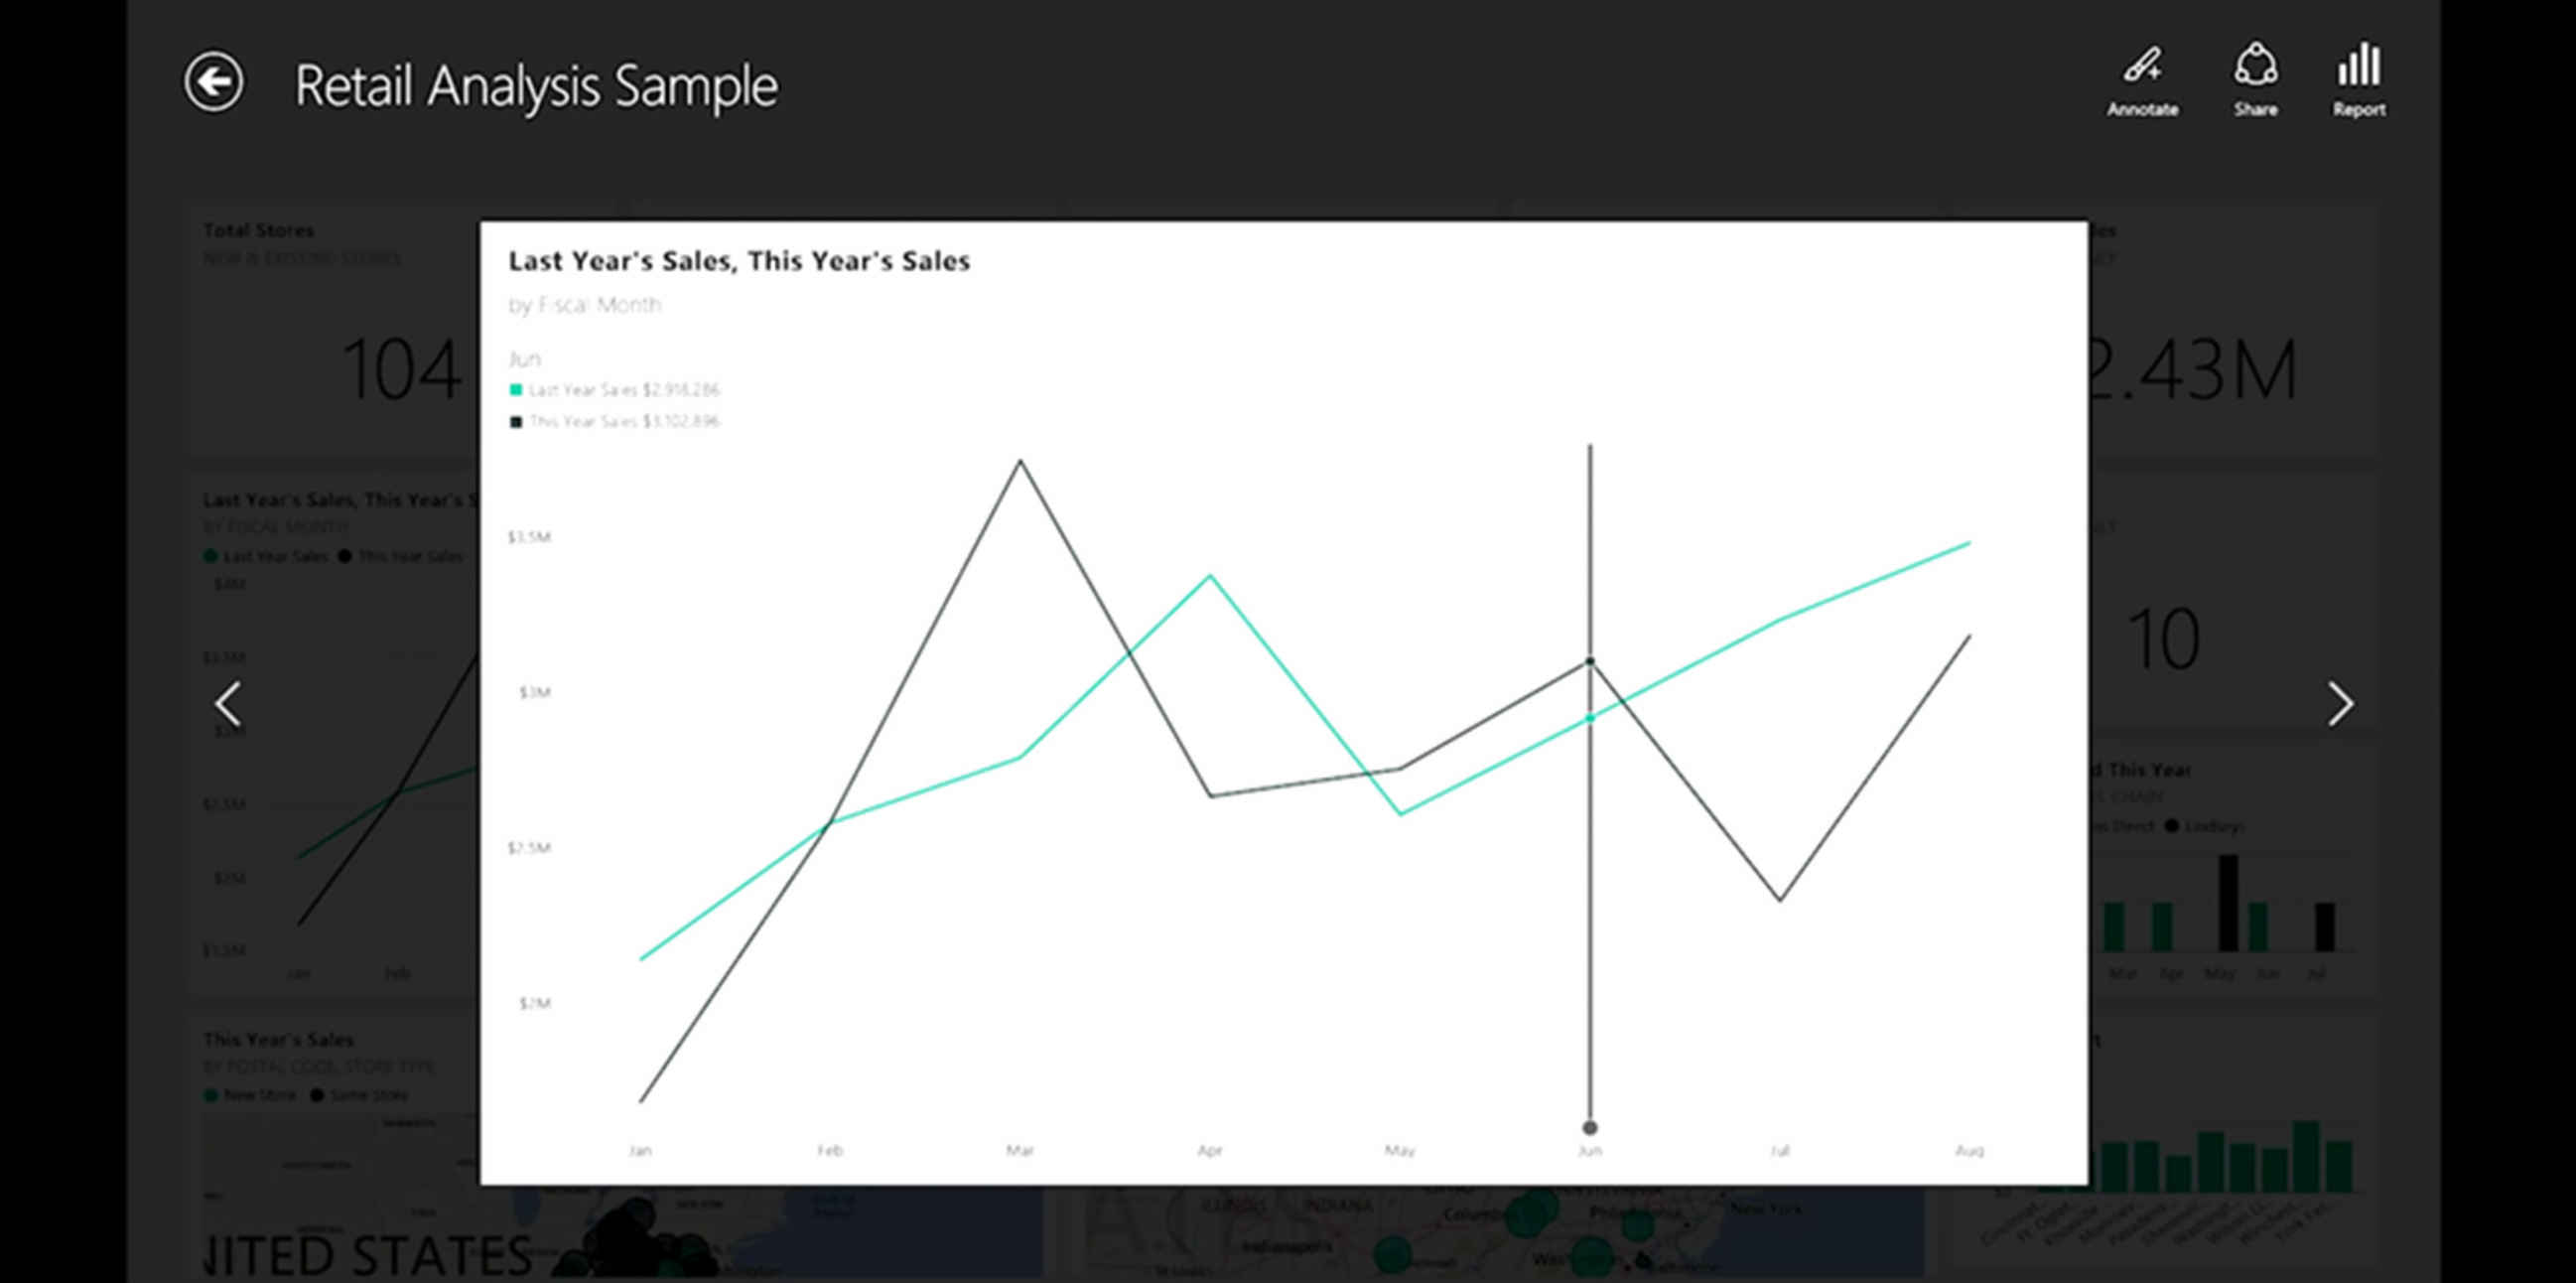
You can also annotate any insights that you discover by tapping the Annotate button in the top right corner. This allows you to draw on a focused tile to highlight particular areas of interest. The annotation tools are found along the bottom of the screen.
Share your annotated tile by tapping the Share link in the top right-hand corner. Tap the Report link in the top right-hand corner to view the report for a tile. This will display the same visualizations that you would see in a web browser or Power BI Desktop. Also, it will include the ability to interact with the report by tapping on bars, drilling down, or using slicers.
Please Note: The details/demonstration of Power BI Mobile is out of the scope of this chapter.
Now you are aware of multiple components of Power BI and ready to move on with more digging into details. However, we would like to stop here and think about why we are calling Power BI as a disruptive reporting platform. Yes, it is disruptive, and it’s challenging the other tools that are available in the market. I would discuss a very significant feature of Power BI that is making it different from others. This feature is called Q&A or Natural Language Query.
Power BI, a product of Microsoft, is self-service business intelligence. It provides highly interactive visualizations, where a user can create reports and dashboards by themselves. Power BI Desktop is an application that can be installed and run on your desktop. In Power BI Desktop, you can create data models or reports and can share them with others on the Power BI Service.
It provides a cloud-based Services –known as Power Bi Services, along with Power BI Desktop interface.
The Power BI service provides fast and easy access to data, supporting inputs from most of the data sources, and the data can be analyzed and visualized by anyone.
- Accessibility: Data is more accessible in Power BI. Power BI can connect to a huge number of Microsoft as well as non-Microsoft solutions.
- Implementation: It’s very easy to implement power BI.
- Robust access control and Security: Row Level Security is the feature of Power BI, which makes it different than others. It allows a team to grant and rescind access on a very controlled level.
- Drag and Drop functionality: Through familiar drag and drop functionality, an end-user can create his/her own report easily—Drill Down Functionality.
Import and Manage Data Sources in Power BI Desktop
Here you will understand the various ways to manage your data sources in your Power BI desktop. Let’s go through the steps to import a data source first.
Import Data Source to Power BI Desktop
To Import a data source into your Power BI Desktop, follow the below steps:
- From the ‘Home’ ribbon, select ‘Get data’ or click on the down arrow next to ‘Get Data.’
- The drop Down will show some frequently used data sources along with an option ‘More’ at the bottom.
- Click on the ‘More’ will give the ‘Get Data’ menu. The ‘Get data’ menu can be brought up by clicking on the ‘Get Data’ button in the Home ribbon.
- The data sources have been categorized, as shown in the left pane of the above snapshot.
- The required data source can be selected just by selecting the proper category and data source name. The data source ‘Oracle database’ has been selected which comes under ‘Database.’
- By selecting the button ‘Connect,’ a pop up will appear, which will have a label where the Server name to be put.
- After putting the server name / global database name as per the above snapshot, the window will appear once ‘ok’ is clicked.
- Put the credentials in the Username and Password boxes as shown above and click ‘Connect.’ Once the data source is connected, a window will appear where you need to select the required table/tables.
- After selecting the required tables, click on the ‘Load’ button.
These steps will show you how to manage the data sources that you have already connected to your Power BI Desktop.
- From the ‘File’ drop-down, select ‘Options and Settings’ -> ‘Data Source Settings.’
- The ‘Data Source Settings’ window will display all the Data sources as below:
Data sources in the current file: this will have the list of all data sources which have been connected in the current file.
Global permissions : this will have the list of all data sources which have been connected previously in all the files.
Change Source
The below steps will show you how to change the source/ sources. Please note that the ‘Change Source’ option is available only for the current file.
- After selecting the source name, which you want to change for the current file, Once you click on the ‘Change Source’ button at the bottom left corner of the window.
- Replace the old Source name ( System Identifier ) with the new one and click on the ‘OK’ button.
- If the new source which has been added is not connected previously in your Power BI Desktop, then after replacing the new source following the steps mentioned above, once you click on the refresh button ( Home ribbon), a pop up window will appear. Because you are connecting this particular data source for the first time in your Power BI Desktop, you need to give the credentials there.
Edit Permissions
In case of situations where:
- password has been modified for a particular user or
- (2) User needs to be changed to connect to a particular source.
The below steps can be followed:
- In the ‘Data Source Settings’ window ( shown above), select the particular data source, and hit the ‘Edit Permissions’ button.
- The ‘Edit’ button there in the Edit permission window will allow you to change/modify the credentials for the current data source.
Clear Permissions
The credentials to connect to a data source can be removed following the below steps:
In the ‘Data Source Settings’ window, select the particular data source and hit the ‘Clear Permissions’ button.
From the drop-down of ‘Clear Permissions’ button, you can choose:
(1) Clear Permissions: credentials will be removed only for the selected data source
(2) Clear all permissions: credentials will be removed for all the data sources.
Do you know that you can ask questions from your data, not only using programming queries but even through the natural language? Yes, natural means a natural language that you often use while talking about data. Let’s understand with an example. You often ask, “What is your total sale for June?” or “Which product is the top seller?” and so on. Now imagine you are typing such statements, and as an answer, you are getting the stunning visualizations showing the sought information.
Let’s understand this concept by following examples.
The preceding figures are showing the results of two very generic questions, what is the total profit? And what is the total sale? As a result, you get two widgets showing the sought information.
You can use the Q&A feature to find more about your data using the intuitive, NLP capabilities and get the answers back with the help of graphs and charts. Please note that Q&A is different from a search engine capability. Q&A only provides results about the data in Power BI.
How to use Power BI Q&A
Q&A feature is available on Power BI online service and Power BI Mobile. But not on Power BI desktop. The Q&A question box is a text box where you can easily type your question with the help of NLP. Q&A can recognize the typed words and can figure out the dataset to be used to find answers to your questions. Q&A is also capable of forming your question with the help of auto-prediction, textual aids, and restatement.
Step 1 . Click inside the question box. Now, the Q&A will show a dropdown with helpful suggestions even before you type anything in the question box.
The dropdown list would display the following:
- All the questions which are used in creating the tiles already present in the dashboard.
- The name of the tables present inside the dataset underlying it.
You can type your question and keep on refining it to reach to specific answer that you want an answer for. Alternatively, you can also use the name of the table that can help you to form a completely new question.
Step 2 . Select from the displayed dropdown, or you can also start typing the question of your own choice of question.
Step 3 . While you are typing a question, Power BI Q&A selects the most suitable visualization to show your answer; and this visualization would change dynamically as you refine the question, as shown in the following figures.
- The question here is: total units of 2020 by month
- The question here is modified to total units of 2020 by month by manufacturer
Step 4 . While you type your question, the Q&A feature searches for an answer in any dataset, which is having a tile placed in its dashboard. If each tile is from the Sales and Marketing Sample, the answer is going to come from Sales and Marketing Sample. If there are tiles from Sales and Marketing Sample and Other Dataset, then the Q&A feature will look for the best answer present in both these datasets.
Please note: You need to be cautious if only one tile is present in the Sales and Marketing Sample, and by chance, you are removing it from the dashboard, the Q&A feature will not be having any access to Sales and Marketing Sample.
Step 5. Once you are satisfied with the overall result, you can now pin the visualization to any dashboard with the help of a pin icon present at the top right corner. If you have not created the dashboard yourself, or it has been shared with you from any other member, you are not allowed to pin the visualization.
Step 6 . You can also tell Power BI Q&A functionality the type of visualization you want to view. If you noticed, the preceding graph is a bar chart. If you want a line chart, you just need to add word line after your query, and you will get the visualization changed to a line chart.

