Chapter 1
Visual Studio 2012
What's in this chapter?
Versions of Visual Studio
An introduction to key Visual Basic terms
Targeting a runtime environment
Creating a baseline Visual Basic Windows Form
Project templates
Project properties—application, compilation, debug
Setting properties
IntelliSense, code expansion, and code snippets
Debugging
The Class Designer
on the Download Code tab. The code is in the chapter 1 download and individually named according to the code filenames listed in the chapter.
You can work with Visual Basic without Visual Studio. In practice, however, most Visual Basic developers treat the two as almost inseparable; without a version of Visual Studio, you're forced to work from the command line to create project files by hand, to make calls to the associated compilers, and to manually address the tools necessary to build your application. While Visual Basic supports this at the same level as C#, F#, C++, and other .NET languages, this isn't the typical focus of a Visual Basic professional.
Visual Basic's success rose from its increased productivity in comparison to other languages when building business applications. Visual Studio 2012 increases your productivity and provides assistance in debugging your applications and is the natural tool for Visual Basic developers.
Accordingly this book starts off by introducing you to Visual Studio 2012 and how to build and manage Visual Basic applications. The focus of this chapter is on ensuring that everyone has a core set of knowledge related to tasks like creating and debugging applications in Visual Studio 2012. Visual Studio 2012 is used throughout the book for building solutions. Note while this is the start, don't think of it as an “intro” chapter. This chapter will intro key elements of working with Visual Studio, but will also go beyond that. You may find yourself referencing back to it later for advanced topics that you glossed over your first time through. Visual Studio is a powerful and, at times, complex tool, and you aren't expected to master it on your first read through this chapter.
This chapter provides an overview of many of the capabilities of Visual Studio 2012. The goal is to demonstrate how Visual Studio makes you, as a developer, more productive and successful.
briefly summarizes most of the keywords discussed in the preceding section, and provides a short description of their meaning in Visual Basic. Keep in mind there are two commonly used terms that aren't Visual Basic keywords that you will read repeatedly, including in the glossary: 1. Method—A generic name for a named set of commands. In Visual Basic, both subs and functions are types of methods.2. Instance—When a class is created, the resulting object is an instance of the class's definition.
Commonly Used Keywords in Visual Basic
| Keyword | Description |
| Namespace | A collection of classes that provide related capabilities. For example, the System.Drawing namespace contains classes associated with graphics. |
| Class | A definition of an object. Includes properties (variables) and methods, which can be Subs or Functions. |
| Sub | A method that contains a set of commands, allows data to be transferred as parameters, and provides scope around local variables and commands, but does not return a value. |
| Function | A method that contains a set of commands, returns a value, allows data to be transferred as parameters, and provides scope around local variables and commands. |
| Return | Ends the currently executing Sub or Function. Combined with a return value for functions. |
| Dim | Declares and defines a new variable. |
| New | Creates an instance of an object. |
| Nothing | Used to indicate that a variable has no value. Equivalent to null in other languages and databases. |
| Me | A reference to the instance of the object within which a method is executing. |
| Console | A type of application that relies on a command-line interface. Console applications are commonly used for simple test frames. Also refers to a .NET Framework Class that manages access of the command window to and from which applications can read and write text data. |
| Module | A code block that isn't a class but which can contain Sub and Function methods. Used when only a single copy of code or data is needed in memory. |
Even though the focus of this chapter is on Visual Studio, during this introduction a few basic elements of Visual Basic will be referenced and need to be spelled out. This way, as you read, you can understand the examples. Chapter 2, for instance, covers working with namespaces, but some examples and other code are introduced in this chapter that will mention the term, so it is defined here.
Let's begin with namespace. When .NET was being created, the developers realized that attempting to organize all of these classes required a system. A namespace is an arbitrary system that the .NET developers used to group classes containing common functionality. A namespace can have multiple levels of grouping, each separated by a period (.). Thus, the System namespace is the basis for classes that are used throughout .NET, while the Microsoft.VisualBasic namespace is used for classes in the underlying .NET Framework but specific to Visual Basic. At its most basic level, a namespace does not imply or indicate anything regarding the relationships between the class implementations in that namespace; it is just a way of managing the complexity of both your custom application's classes, whether it be a small or large collection, and that of the .NET Framework's thousands of classes. As noted earlier, namespaces are covered in detail in Chapter 2.
Next is the keyword Class. Chapters 3 and 4 provide details on object-oriented syntax and the related keywords for objects and types, but a basic definition of this keyword is needed here. The Class keyword designates a common set of data and behavior within your application. The class is the definition of an object, in the same way that your source code, when compiled, is the definition of an application. When someone runs your code, it is considered to be an instance of your application. Similarly, when your code creates or instantiates an object from your class definition, it is considered to be an instance of that class, or an instance of that object.
Creating an instance of an object has two parts. The first part is the New command, which tells the compiler to create an instance of that class. This command instructs code to call your object definition and instantiate it. In some cases you might need to run a method and get a return value, but in most cases you use the New command to assign that instance of an object to a variable. A variable is quite literally something which can hold a reference to that class's instance.
To declare a variable in Visual Basic, you use the Dim statement. Dim is short for “dimension” and comes from the ancient past of Basic, which preceded Visual Basic as a language. The idea is that you are telling the system to allocate or dimension a section of memory to hold data. As discussed in subsequent chapters on objects, the Dim statement may be replaced by another keyword such as Public or Private that not only dimensions the new value, but also limits the accessibility of that value. Each variable declaration uses a Dim statement similar to the example that follows, which declares a new variable, winForm:
Dim winForm As System.Windows.Forms.Form = New System.Windows.Forms.Form()
In the preceding example, the code declares a new variable (winForm) of the type Form. This variable is then set to an instance of a Form object. It might also be assigned to an existing instance of a Form object or alternatively to Nothing. The Nothing keyword is a way of telling the system that the variable does not currently have any value, and as such is not actually using any memory on the heap. Later in this chapter, in the discussion of value and reference types, keep in mind that only reference types can be set to Nothing.
A class consists of both state and behavior. State is a fancy way of referring to the fact that the class has one or more values also known as properties associated with it. Embedded in the class definition are zero or more Dim statements that create variables used to store the properties of the class. When you create an instance of this class, you create these variables; and in most cases the class contains logic to populate them. The logic used for this, and to carry out other actions, is the behavior. This behavior is encapsulated in what, in the object-oriented world, are known as methods.
However, Visual Basic doesn't have a “method” keyword. Instead, it has two other keywords that are brought forward from Visual Basic's days as a procedural language. The first is Sub. Sub, short for “subroutine,” and it defines a block of code that carries out some action. When this block of code completes, it returns control to the code that called it without returning a value. The following snippet shows the declaration of a Sub:
Private Sub Load(ByVal object As System.Object) End Sub
The preceding example shows the start of a Sub called Load. For now you can ignore the word Private at the start of this declaration; this is related to the object and is further explained in the next chapter. This method is implemented as a Sub because it doesn't return a value and accepts one parameter when it is called. Thus, in other languages this might be considered and written explicitly as a function that returns Nothing.
The preceding method declaration for Sub Load also includes a single parameter, object, which is declared as being of type System.Object. The meaning of the ByVal qualifier is explained in chapter 2, but is related to how that value is passed to this method. The code that actually loads the object would be written between the line declaring this method and the End Sub line.
Alternatively, a method can return a value; Visual Basic uses the keyword Function to describe this behavior. In Visual Basic, the only difference between a Sub and the method type Function is the return type.
The Function declaration shown in the following sample code specifies the return type of the function as a Long value. A Function works just like a Sub with the exception that a Function returns a value, which can be Nothing. This is an important distinction, because when you declare a function the compiler expects it to include a Return statement. The Return statement is used to indicate that even though additional lines of code may remain within a Function or Sub, those lines of code should not be executed. Instead, the Function or Sub should end processing at the current line, and if it is in a function, the return value should be returned. To declare a Function, you write code similar to the following:
Public Function Add(ByVal ParamArray values() As Integer) As Long Dim result As Long = 0 'TODO: Implement this function Return result 'What if there is more code Return result End Function
In the preceding example, note that after the function initializes the second line of code, there is a Return statement. There are two Return statements in the code. However, as soon as the first Return statement is reached, none of the remaining code in this function is executed. The Return statement immediately halts execution of a method, even from within a loop.
As shown in the preceding example, the function's return value is assigned to a local variable until returned as part of the Return statement. For a Sub, there would be no value on the line with the Return statement, as a Sub does not return a value when it completes. When returned, the return value is usually assigned to something else. This is shown in the next example line of code, which calls a function:
Dim ctrl = Me.Add(1, 2)
The preceding example demonstrates a call to a function. The value returned by the function Add is a Long, and the code assigns this to the variable ctrl. It also demonstrates another keyword that you should be aware of: Me. The Me keyword is how, within an object, you can reference the current instance of that object.
You may have noticed that in all the sample code presented thus far, each line is a complete command. If you're familiar with another programming language, then you may be used to seeing a specific character that indicates the end of a complete set of commands. Several popular languages use a semicolon to indicate the end of a command line.
Visual Basic doesn't use visible punctuation to end each line. Traditionally, the BASIC family of languages viewed source files more like a list, whereby each item on the list is placed on its own line. At one point the term was source listing. By default, Visual Basic ends each source list item with the carriage-return line feed, and treats it as a command line. In some languages, a command such as X = Y can span several lines in the source file until a semicolon or other terminating character is reached. Thus previously, in Visual Basic, that entire statement would be found on a single line unless the user explicitly indicates that it is to continue onto another line.
To explicitly indicate that a command line spans more than one physical line, you'll see the use of the underscore at the end of the line to be continued. However, one of the features of Visual Basic, originally introduced in version 10 with Visual Studio 2010, is support for an implicit underscore when extending a line past the carriage-return line feed. However, this feature is limited, as there are still places where underscores are needed.
When a line ends with the underscore character, this explicitly tells Visual Basic that the code on that line does not constitute a completed set of commands. The compiler will then continue to the next line to find the continuation of the command, and will end when a carriage-return line feed is found without an accompanying underscore.
In other words, Visual Basic enables you to use exceptionally long lines and indicate that the code has been spread across multiple lines to improve readability. The following line demonstrates the use of the underscore to extend a line of code:
MessageBox.Show("Hello World", "A Message Box Title", _ MessageBoxButtons.OK, MessageBoxIcon.Information) Prior to Visual Basic 10 the preceding example illustrated the only way to extend a single command line beyond one physical line in your source code. The preceding line of code can now be written as follows:
MessageBox.Show("Hello World", "A Message Box Title", MessageBoxButtons.OK, MessageBoxIcon.Information) The compiler now recognizes certain key characters like the “,” or the “=” as the type of statement where a line isn't going to end. The compiler doesn't account for every situation and won't just look for a line extension anytime a line doesn't compile. That would be a performance nightmare; however, there are several logical places where you, as a developer, can choose to break a command across lines and do so without needing to insert an underscore to give the compiler a hint about the extended line.
Finally, note that in Visual Basic it is also possible to place multiple different statements on a single line, by separating the statements with colons. However, this is generally considered a poor coding practice because it reduces readability.
Console Applications
The simplest type of application is a console application. This application doesn't have much of a user interface; in fact, for those old enough to remember the MS-DOS operating system, a console application looks just like an MS-DOS application. It works in a command window without support for graphics or input devices such as a mouse. A console application is a text-based user interface that displays text characters and reads input from the keyboard.
The easiest way to create a console application is to use Visual Studio. For the current discussion let's just look at a sample source file for a Console application, as shown in the following example. Notice that the console application contains a single method, a Sub called Main. By default, if you create a console application in Visual Studio, the code located in the Sub Main is the code which is by default started. However, the Sub Main isn't contained in a class; instead, the Sub Main that follows is contained in a Module:
Module Module1 Sub Main() Console.WriteLine("Hello World") Dim line = Console.ReadLine() End Sub End Module A Module isn't truly a class, but rather a block of code that can contain methods, which are then referenced by code in classes or other modules—or, as in this case, it can represent the execution start for a program. A Module is similar to having a Shared class. The Shared keyword indicates that only a single instance of a given item exists.
For example, in C# the Static keyword is used for this purpose, and can be used to indicate that only a single instance of a given class exists. Visual Basic doesn't support the use of the Shared keyword with a Class declaration; instead, Visual Basic developers create modules that provide the same capability. The Module represents a valid construct to group methods that don't have state-related or instance-specific data.
Note a console application focuses on the Console Class. The Console Class encapsulates Visual Basic's interface with the text-based window that hosts a command prompt from which a command-line program is run. The console window is best thought of as a window encapsulating the older nongraphical style user interface, whereby literally everything was driven from the command prompt. A Shared instance of the Console class is automatically created when you start your application, and it supports a variety of Read and Write methods. In the preceding example, if you were to run the code from within Visual Studio's debugger, then the console window would open and close immediately. To prevent that, you include a final line in the Main Sub, which executes a Read statement so that the program continues to run while waiting for user input.
Creating a Project from a Project Template
While it is possible to create a Visual Basic application working entirely outside of Visual Studio, it is much easier to start from Visual Studio. After you install Visual Studio, you are presented with a screen similar to the one shown in . Different versions of Visual Studio may have a different overall look, but typically the start page lists your most recent projects on the left, some tips for getting started, and a headline section for topics on MSDN that might be of interest. You may or may not immediately recognize that this content is HTML text; more important, the content is based on an RSS feed that retrieves and caches articles appropriate for your version of Visual Studio.
Visual Studio 2012 Start screen
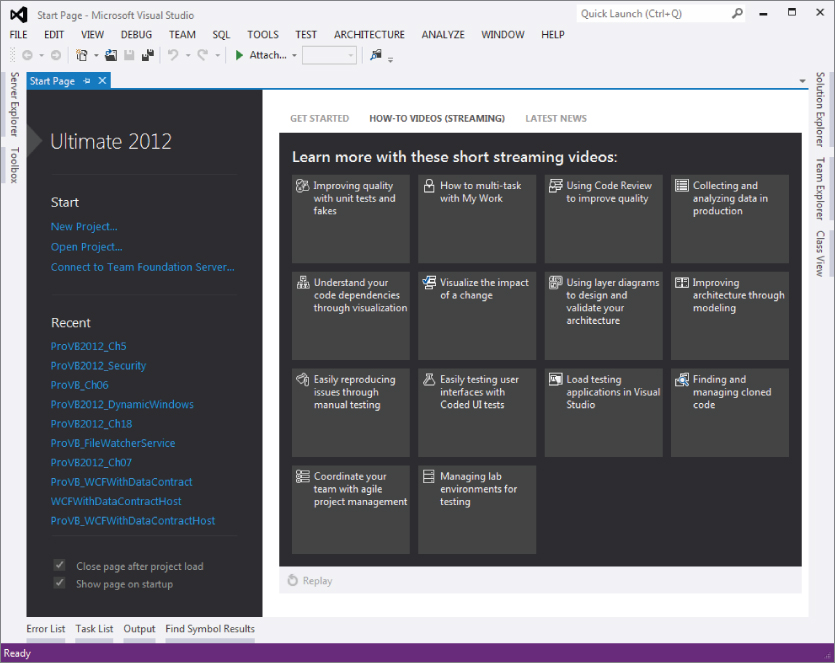
The start page provides a generic starting point either to select the application you intend to work on, to quickly receive vital news related to offers, as shown in the figure, or to connect with external resources via the community links.
Once here, the next step is to create your first project. Selecting File ⇒ New ⇒ Project opens the New Project dialog, shown in . This dialog provides a selection of templates customized by application type. One option is to create a Class Library project. Such a project doesn't include a user interface; and instead of creating an assembly with an .exe file, it creates an assembly with a .dll file. The difference, of course, is that an .exe file indicates an executable that can be started by the operating system, whereas a .dll file represents a library referenced by an application.
New Project dialogue
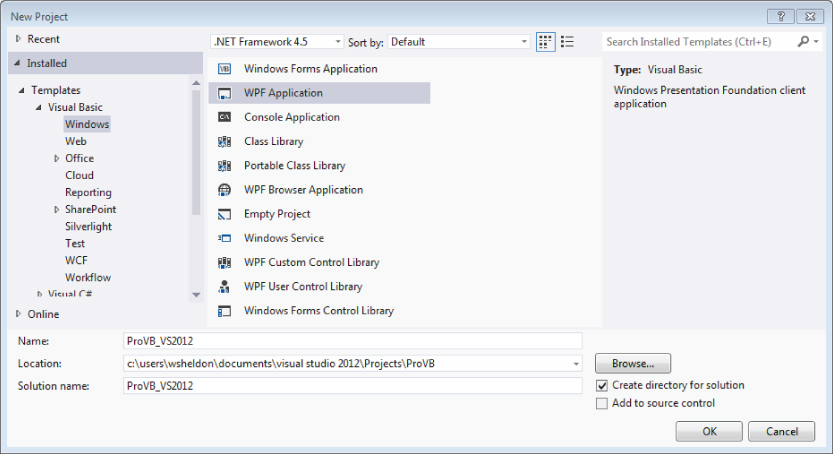
includes the capability to target a specific .NET version in the drop-down box located above the list of project types. If you change this to .NET 2.0, you'll see the dialog change to show only six project types below the selection listed. For the purposes of this chapter, however, you'll want .NET 4.5 selected, and the template list should resemble what is shown in . Note this chapter is going to create a Windows .NET application, not a Windows Store application. Targeting keeps you from attempting to create a project for WPF without recognizing that you also need at least .NET 3.0 available on the client. Although you can change your target after you create your project, be very careful when trying to reduce the version number, as the controls to prevent you from selecting dependencies don't check your existing code base for violations. Changing your targeted framework version for an existing project is covered in more detail later in this chapter.
Not only can you choose to target a specific version of the framework when creating a new project, but this window has a new feature that you'll find all over the place in Visual Studio. In the upper-right corner, there is a control that enables you to search for a specific template. As you work through more of the windows associated with Visual Studio, you'll find that a context-specific search capability has often been added to the new user interface.
Reviewing the top level of the Visual Basic tree in shows that a project type can be further separated into a series of categories:
- Windows—These are projects used to create applications that run on the local computer within the CLR. Because such projects can run on any operating system (OS) hosting the framework, the category “Windows” is something of a misnomer when compared to, for example, “Desktop.”
- Web—You can create these projects, including Web services, from this section of the New Project dialog.
- Office—Visual Studio Tools for Office (VSTO). These are .NET applications that are hosted under Office. Visual Studio 2010 includes a set of templates you can use to target Office 2010, as well as a separate section for templates that target Office 2007.
- Cloud Services—These are projects that target the Azure online environment model. These projects are deployed to the cloud and as such have special implementation and deployment considerations.
- Reporting—This project type enables you to create a Reports application.
- SharePoint—This category provides a selection of SharePoint projects, including Web Part projects, SharePoint Workflow projects, and Business Data Catalog projects, as well as things like site definitions and content type projects. Visual Studio 2010 includes significant new support for SharePoint.
- Silverlight—With Visual Studio 2010, Microsoft has finally provided full support for working with Silverlight projects. Whereas in the past you've had to add the Silverlight SDK and tools to your existing development environment, with Visual Studio 2010 you get support for both Silverlight projects and user interface design within Visual Studio.
- Test—This section is available only to those using Visual Studio Team Suite. It contains the template for a Visual Basic Unit Test project.
- WCF—This is the section where you can create Windows Communication Foundation projects.
- Workflow—This is the section where you can create Windows Workflow Foundation (WF) projects. The templates in this section also include templates for connecting with the SharePoint workflow engine.
Not shown in that list is a Windows Store project group. That option is available only if you are running Visual Studio 2012 on Windows 8. The project group has five different project types under Visual Basic, but they are available only if you aren't just targeting Windows 8, but are actually using a Windows 8 computer.
This chapter assumes you are working on a Windows 7 computer. The reason for this is that it is expected the majority of developers will continue to work outside of Windows RT. If you are working in a Windows 8 or Windows RT environment, then what you'll look for in the list of Visual Basic templates is a Windows Store application. Keep in mind, however, that those projects will only run on Windows 8 computers. Details of working with Windows Store applications are the focus of Chapters 14 and 15.
Visual Studio has other categories for projects, and you have access to other development languages and far more project types than this chapter has room for. When looking to create an application you will choose from one or more of the available project templates. To use more than a single project to create an application you'll leverage what is known as a solution. A solution is created by default whenever you create a new project and contains one or more projects.
When you save your project you will typically create a folder for the solution, then later if you add another project to the same solution, it will be contained in the solution folder. A project is always part of a solution, and a solution can contain multiple projects, each of which creates a different assembly. Typically, for example, you will have one or more Class Libraries that are part of the same solution as your Windows Form or ASP.NET project. For now, you can select a WPF Application project template to use as an example project for this chapter.
For this example, use ProVB_VS2012 as the project name to match the name of the project in the sample code download and then click OK. Visual Studio takes over and uses the Windows Application template to create a new WPF Application project. The project contains a blank form that can be customized, and a variety of other elements that you can explore. Before customizing any code, let's first look at the elements of this new project.
The Solution Explorer
The Solution Explorer is a window that is by default located on the right-hand side of your display when you create a project. It is there to display the contents of your solution and includes the actual source file(s) for each of the projects in your solution. While the Solution Explorer window is available and applicable for Express Edition users, it will never contain more than a single project. Visual Studio provides the ability to leverage multiple projects in a single solution. A .NET solution can contain projects of any .NET language and can include the database, testing, and installation projects as part of the overall solution. The advantage of combining these projects is that it is easier to debug projects that reside in a common solution.
Before discussing these files in depth, let's take a look at the next step, which is to reveal a few additional details about your project. Hover over the small icons at the top of the Solution Explorer until you find the one with the hint “Show All Files.” Click that button in the Solution Explorer to display all of the project files, as shown in . As this image shows, many other files make up your project. Some of these, such as those under the My Project grouping, don't require you to edit them directly. Instead, you can double-click the My Project entry in the Solution Explorer and open the pages to edit your project settings. You do not need to change any of the default settings for this project, but the next section of this chapter walks you through the various property screens.
Visual Studio Solution Explorer
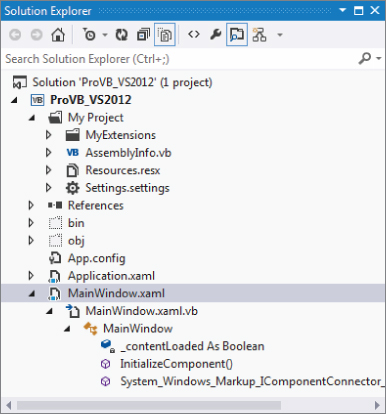
Additionally, with Visual Studio 2012 the Solution Explorer goes below the level of just showing files. Notice how in that below the reference to the VB file, the display transitions into one that gives you class-specific information. The Solution Explorer is no longer just a tool to take you to the files in your project, but a tool that allows you to delve down into your class and jump directly to elements of interest within your solution.
The bin and obj directories shown are used when building your project. The obj directory contains the first-pass object files used by the compiler to create your final executable file. The “binary” or compiled version of your application is then placed in the bin directory by default. Of course, referring to the Microsoft intermediate language (MSIL) code as binary is something of a misnomer, as the actual translation to binary does not occur until runtime, when your application is compiled by the just-in-time (JIT) compiler. However, Microsoft continues to use the bin directory as the default output directory for your project's compilation.
also shows that the project contains an app.config file by default. Most experienced ASP.NET developers are familiar with using web.config files. app.config files work on the same principle in that they contain XML, which is used to store project-specific settings such as database connection strings and other application-specific settings. Using a .config file instead of having your settings in the Windows registry enables your applications to run side-by-side with another version of the application without the settings from either version affecting the other.
For now however, you have a new project and an initial XAML Window, MainWindows, available in the Solution Explorer. In this case, the MainWIndows.xaml file is the primary file associated with the default window. You'll be customizing this window shortly, but before looking at that, it would be useful to look at some of the settings available by opening your Project Properties. An easy way to do this is to right-click on the My Project heading shown in .
Project Properties
Visual Studio uses a vertically tabbed display for editing your project settings. The Project Properties display shown in provides access to the newly created ProVB_VS2012 project settings. The Project Properties window gives you access to several different aspects of your project. Some, such as Signing, Security, and Publish, are covered in later chapters.
Project Properties—Application tab
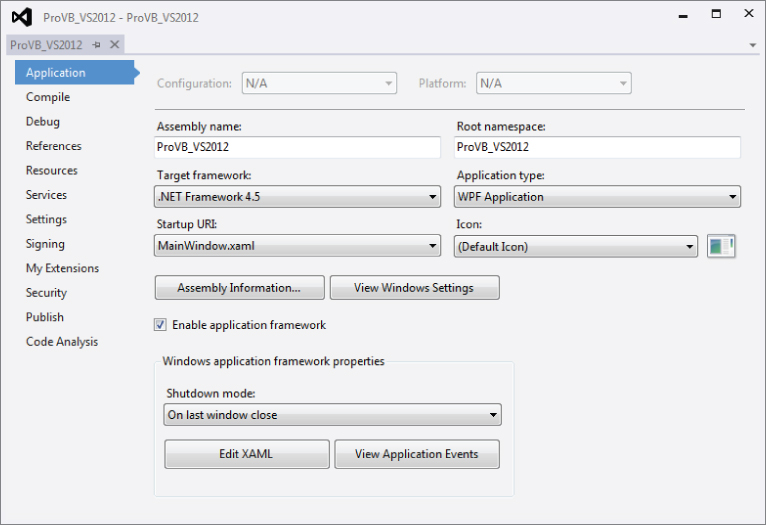
You can customize your assembly name from this screen, as well as your root namespace. In addition, you can now change the target framework for your application and reset the type of application and object to be referenced when starting your application. However, resetting the application type is not typically recommended. In some cases, if you start with the wrong application type, it is better to create a new application due to all of the embedded settings in the application template.
In addition, you can change attributes such as the class, which should be called when starting your project. Thus, you could select a screen other than the default MainWindow.xaml as the startup screen. You can also associate a given default icon with your form (refer to ).
Near the middle of the dialogue are two buttons. Assembly Information is covered in the next section. The other button, labeled View Windows Settings, refers to your app.manifest file. Within this file are application settings for things like Windows compatibility and User Access Control settings, which enable you to specify that only certain users can successfully start your application. In short, you have the option to limit your application access to a specific set of users. The UAC settings are covered in more detail in Chapter 18.
Finally, there is a section associated with enabling an application framework. The application framework is a set of optional components that enable you to extend your application with custom events and items, or access your base application class, with minimal effort. Enabling the framework is the default, but unless you want to change the default settings, the behavior is the same—as if the framework weren't enabled. The third button, View Application Events, adds a new source file, ApplicationEvents.vb, to your project, which includes documentation about which application events are available.
Assembly Information Screen
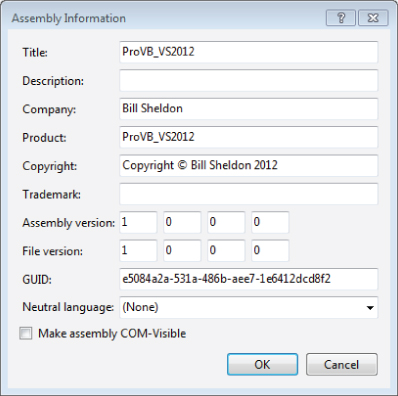
Selecting the Assembly Information button from within your My Project window opens the Assembly Information dialogue. Within this dialogue, shown in , you can define file properties, such as your company's name and versioning information, which will be embedded in the operating system's file attributes for your project's output. Note these values are stored as assembly attributes in AssemblyInfo.vb.
Project Properties Assembly Information dialogue
Assembly Attributes
The AssemblyInfo.vb file contains attributes that are used to set information about the assembly. Each attribute has an assembly modifier, shown in the following example:
<Assembly: AssemblyTitle("")> All the attributes set within this file provide information that is contained within the assembly metadata. The attributes contained within the file are summarized in :
Attributes of the AssemblyInfo.vb File
| Attribute | Description |
| Assembly Title | This sets the name of the assembly, which appears within the file properties of the compiled file as the description. |
| Assembly Description | This attribute is used to provide a textual description of the assembly, which is added to the Comments property for the file. |
| Assembly Company | This sets the name of the company that produced the assembly. The name set here appears within the Version tab of the file properties. |
| Assembly Product | This attribute sets the product name of the resulting assembly. The product name appears within the Version tab of the file properties. |
| Assembly Copyright | The copyright information for the assembly. This value appears on the Version tab of the file properties. |
| Assembly Trademark | Used to assign any trademark information to the assembly. This information appears on the Version tab of the file properties. |
| Assembly Version | This attribute is used to set the version number of the assembly. Assembly version numbers can be generated, which is the default setting for .NET applications. This is covered in more detail in Chapter 17. |
| Assembly File Version | This attribute is used to set the version number of the executable files. |
| COM Visible | This attribute is used to indicate whether this assembly should be registered and made available to COM applications. |
| Guid | If the assembly is to be exposed as a traditional COM object, then the value of this attribute becomes the ID of the resulting type library. |
| NeutralResourcesLanguageAttribute | If specified, provides the default culture to use when the current user's culture settings aren't explicitly matched in a localized application. Localization is covered further in Chapter 15. |
Compiler Settings
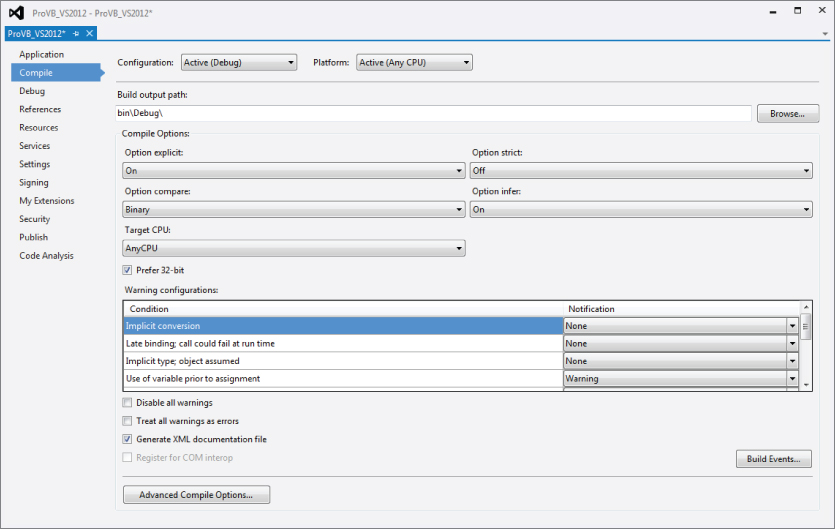
When you select the Compile tab of the Project Properties, you should see a window similar to the one shown in . At the top of the display you should see your Configuration and Platform settings. By default, these are for Debug and Any CPU.
Project Properties—Compile tab
If you don't see these drop-downs in your display, you can restore them by selecting Tools ⇒ Options, and then turning on the Advanced compile options. The main reason to restore these options has to do with being able to properly target the output of your application build.
Before getting to the top four drop-downs related to compile options, let's quickly discuss the fifth drop-down for the Target CPU. In Visual Studio, the default is to target AnyCPU, but this means that on a 64-bit developer workstation, Visual Studio will target a 64-bit assembly for your debug environment. When working on a 64-bit workstation, you must explicitly target an x86 environment in order to enable both Edit and Continue as well as COM-Interop. COM is a 32-bit, so you are required to target a 32-bit/x86 environment to support COM-Interop.
Aside from your default project file output directory and Target CPU, this page contains several compiler options. The Option Explicit, Option Infer, and Option Strict settings directly affect your variable usage. Each of the following settings can be edited by adding an Option declaration to the top of your source code file. When placed within a source file each of the following settings applies to all of the code entered in that source file, but only to the code in that file:
- Option Explicit—This option has not changed from previous versions of Visual Basic. When enabled, it ensures that every variable is explicitly declared. Of course, if you are using Option Strict, then this setting doesn't matter because the compiler won't recognize the type of an undeclared variable. To my knowledge, there's no good reason to ever turn this option off unless you are developing pure dynamic solutions, for which compile time typing is unavailable.
- Option Strict—When this option is enabled, the compiler must be able to determine the type of each variable, and if an assignment between two variables requires a type conversion—for example, from Integer to Boolean—then the conversion between the two types must be expressed explicitly.
- Option Compare—This option determines whether strings should be compared as binary strings or whether the array of characters should be compared as text. In most cases, leaving this as binary is appropriate. Doing a text comparison requires the system to convert the binary values that are stored internally prior to comparison. However, the advantage of a text-based comparison is that the character “A” is equal to “a” because the comparison is case-insensitive. This enables you to perform comparisons that don't require an explicit case conversion of the compared strings. In most cases, however, this conversion still occurs, so it's better to use binary comparison and explicitly convert the case as required.
- Option Infer—This option was new in Visual Studio 2008 and was added due to the requirements of LINQ. When you execute a LINQ statement, you can have returned a data table that may or may not be completely typed in advance. As a result, the types need to be inferred when the command is executed. Thus, instead of a variable that is declared without an explicit type being defined as an object, the compiler and runtime attempt to infer the correct type for this object.
From the properties page Option Explicit, Option Strict, Option Compare, and Option Infer can be set to either On or Off for your project. Visual Studio 2012 makes it easy for you to customize specific compiler conditions for your entire project. However, as noted, you can also make changes to the individual compiler checks that are set using something like Option Strict.
Notice that as you change your Option Strict settings in particular, the notifications with the top few conditions are automatically updated to reflect the specific requirements of this new setting. Therefore, you can literally create a custom version of the Option Strict settings by turning on and off individual compiler settings for your project. In general, this table lists a set of conditions that relate to programming practices you might want to avoid or prevent, and which you should definitely be aware of. The use of warnings for the majority of these conditions is appropriate, as there are valid reasons why you might want to use or avoid each but might also want to be able to do each.
Basically, these conditions represent possible runtime error conditions that the compiler can't detect in advance, except to identify that a possibility for that runtime error exists. Selecting a Warning for a setting bypasses that behavior, as the compiler will warn you but allow the code to remain. Conversely, setting a behavior to Error prevents compilation; thus, even if your code might be written to never have a problem, the compiler will prevent it from being used.
An example of why these conditions are noteworthy is the warning of an instance variable accessing a Shared property. A Shared property is the same across all instances of a class. Thus, if a specific instance of a class is updating a Shared property, then it is appropriate to get a warning to that effect. This action is one that can lead to errors, as new developers sometimes fail to realize that a Shared property value is common across all instances of a class, so if one instance updates the value, then the new value is seen by all other instances. Thus, you can block this dangerous but certainly valid code to prevent errors related to using a Shared property.
As noted earlier, option settings can be specific to each source file. This involves adding a line to the top of the source file to indicate to the compiler the status of that Option. The following lines will override your project's default setting for the specified options. However, while this can be done on a per-source listing basis, this is not the recommended way to manage these options. For starters, consistently adding this line to each of your source files is time-consuming and potentially open to error:
Option Explicit On Option Compare Text Option Strict On Option Infer On
Most experienced developers agree that using Option Strict and being forced to recognize when type conversions are occurring is a good thing. Certainly, when developing software that will be deployed in a production environment, anything that can be done to help prevent runtime errors is desirable. However, Option Strict can slow the development of a program because you are forced to explicitly define each conversion that needs to occur. If you are developing a prototype or demo component that has a limited life, you might find this option limiting.
If that were the end of the argument, then many developers would simply turn the option off and forget about it, but Option Strict has a runtime benefit. When type conversions are explicitly identified, the system performs them faster. Implicit conversions require the runtime system to first identify the types involved in a conversion and then obtain the correct handler.
Another advantage of Option Strict is that during implementation, developers are forced to consider every place a conversion might occur. Perhaps the development team didn't realize that some of the assignment operations resulted in a type conversion. Setting up projects that require explicit conversions means that the resulting code tends to have type consistency to avoid conversions, thus reducing the number of conversions in the final code. The result is not only conversions that run faster, but also, it is hoped, a smaller number of conversions.
Option Infer is a powerful feature. It is used as part of LINQ and the features that support LINQ, but it affects all code. In the past, you needed to write the AS <type> portion of every variable definition in order to have a variable defined with an explicit type. However, now you can dimension a variable and assign it an integer or set it equal to another object, and the AS Integer portion of your declaration isn't required; it is inferred as part of the assignment operation. Be careful with Option Infer; if abused it can make your code obscure, since it reduces readability by potentially hiding the true type associated with a variable. Some developers prefer to limit Option Infer to per-file declarations to limit its use to when it is needed, for example with LINQ.
In addition, note that Option Infer is directly affected by Option Strict. In an ideal world, Option Strict Off would require that Option Infer also be turned off or disabled in the user interface. That isn't the case, although it is the behavior that is seen; once Option Strict is off, Option Infer is essentially ignored.
Also note in that below the grid of individual settings is a series of check boxes. Two of these are self-explanatory; the third is the option to generate XML comments for your assembly. These comments are generated based on the XML comments that you enter for each of the classes, methods, and properties in your source file.
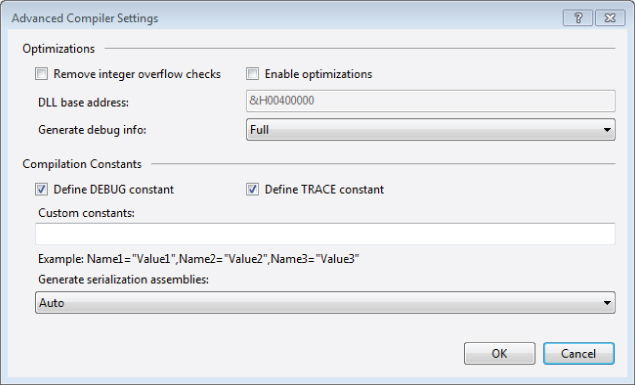
Finally, at the bottom is the Advanced Compile Options button. This button opens the Advanced Compiler Settings dialogue shown in . Note a couple of key elements on this screen, the first being the “Remove integer overflow checks” check box. When these options are not enabled, the result is a performance hit on Visual Basic applications in comparison to C#. The compilation constants are values you shouldn't need to touch normally. Similarly, the generation of serialization assemblies is something that is probably best left in auto mode.
Advanced Compiler Settings
Debug Properties
shows the project debugger startup options from Visual Studio 2012. The default action is to start the current project. However, developers have two additional options. The first is to start an external program. In other words, if you are working on a DLL or a user control, then you might want to have that application start, which can then execute your assembly. Doing this is essentially a shortcut, eliminating the need to bind to a running process. Similarly, for Web development, you can reference a specific URL to start that Web application.
Project Properties—Debug Tab
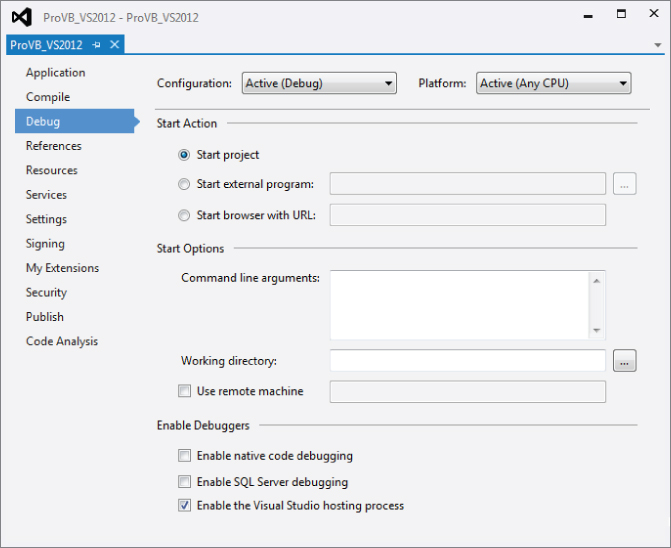
Next developers have three options related to starting the debugger. The first is to apply command-line arguments to the startup of a given application. This, of course, is most useful for console applications, but in some cases developers add command-line parameters to GUI applications. The second option is to select a different directory, a working directory, to be used to run the application. Generally, this isn't necessary; but it's desirable in some cases because of path or permission requirements or having an isolated runtime area.
As noted, Visual Studio provides support for remote debugging, although such debugging is involved and not configured for simple scenarios. Remote debugging can be a useful tool when working with an integration test environment where developers are prevented from installing Visual Studio but need to be able to debug issues. However, you shouldn't be limited by just using the debugger for understanding what is occurring in your application at runtime.
Finally, as might be expected, users of Visual Studio who work with multiple languages, and who use tools that are tightly integrated with SQL Server, have additional debuggers. Within the Enable Debuggers section of this display are three check boxes. The first of these is for native code debugging and turns on support for debugging outside of the CLR—what is known as unmanaged code. As a Visual Basic developer, the only time you should be using unmanaged code is when you are referencing legacy COM components. The developers most likely to use this debugger work in C++.
The next option turns on support for SQL Server debugging, a potentially useful feature. In short, it's possible, although the steps are not trivial, to have the Visual Studio debugging engine step directly into T-SQL stored procedures so that you can see the interim results as they occur within a complex stored procedure.
Finally, the last check box is one you should typically leave unchanged. When you start an application for debugging the default behavior—represented by this check box—it hosts your running application within another process. Called the Visual Studio host, this application creates a dynamic environment controlled by Visual Studio within which your application runs. The host process allows Visual Studio to provide enhanced runtime features. For some items such as debugging partial trust applications, this environment is required to simulate that model. Because of this, if you are using reflection, you'll find that your application name references this host process when debugging.
References
It's possible to add additional references as part of your project. Similar to the default code files that are created with a new project, each project template has a default set of referenced libraries. Actually, it has a set of imported namespaces and a subset of the imported namespaces also referenced across the project. This means that while you can easily reference the classes in the referenced namespaces, you still need to fully qualify a reference to something less common. For example, to use a StringBuilder you'll need to specify the fully qualified name of System.Text.StringBuilder. Even though the System.Text namespace is referenced it hasn't been imported by default.
Keep in mind that changing your target framework does not update any existing references. If you are going to attempt to target the .NET 2.0 Framework, then you'll want to remove references that have a version higher than 2.0.0.0. References such as System.Core enable new features in the System namespace that are associated with .NET 4.0.
To review details about the imported and referenced namespaces, select the References tab in your Project Properties display, as shown in . This tab enables you to check for unused references and even define reference paths. More important, it is from this tab that you select other .NET Class Libraries and applications, as well as COM components. Selecting the Add drop-down button gives you the option to add a reference to a local DLL or a Web service.
Project Properties—References tab
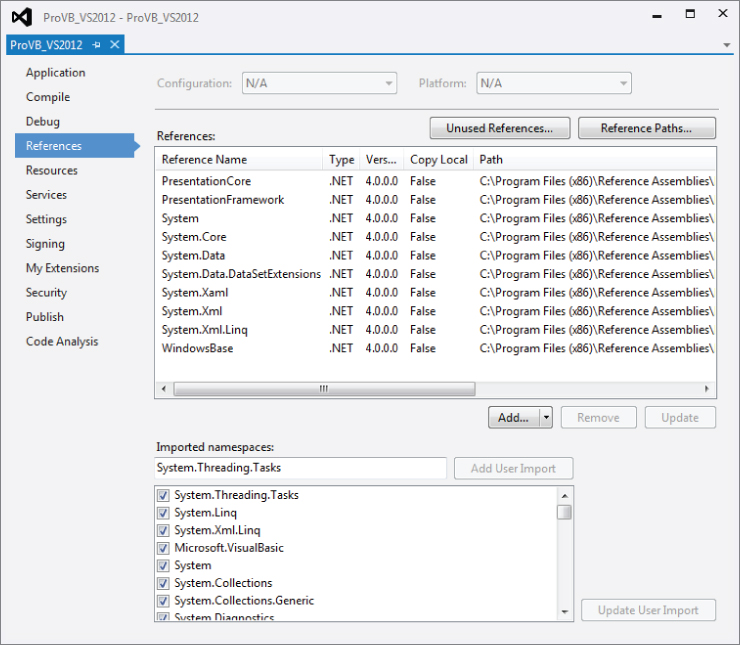
When referencing DLLs you have three options: reference an assembly from the GAC, reference an assembly based on a file path, or reference another assembly from within your current solution. Each of these options has advantages and disadvantages. The GAC is covered in more detail in Chapter 17.
In addition you can reference other assemblies that are part of your solution. If your solution consists of more than a single project, then it is straightforward and highly recommended to use project references in order to enable those projects to reference each other. While you should avoid circular references—Project A references Project B which references Project A—using project references is preferred over file references. With project references, Visual Studio can map updates to these assemblies as they occur during a build of the solution.
This is different from adding a reference to a DLL that is located within a specified directory. When you create a reference via a path specification, Visual Studio can check that path for an updated copy of the reference, but your code is no longer as portable as it would be with a project reference. More important, unless there is a major revision, Visual Studio usually fails to detect the types of changes you are likely to make to that file during the development process. As a result, you'll need to manually update the referenced file in the local directory of the assembly that's referencing it.
One commonly used technique with custom references is to ensure that instead of referencing third-party controls based on their location, add the property “copy local” for some references so that the version-specific copy of the control deploys with the code that depends on it.
Resources
In addition to referencing other assemblies, it is quite common for a .NET application to need to reference things such as images, icons, audio, and other files. These files aren't used to provide application logic but are used at runtime to provide support for the look, feel, and even text used to communicate with the application's user. In theory, you can reference a series of images associated with your application by looking for those images based on the installed file path of your application. Doing so, however, places your application's runtime behavior at risk, because a user might choose to replace or delete your files.
This is where project references become useful. Instead of placing the raw files onto the operating system alongside your executable, Visual Studio will package these files into your executable so that they are less likely to be lost or damaged. shows the Resources tab, which enables you to review and edit all the existing resources within a project, as well as import files for use as resources in your project. It even allows you to create new resources from scratch.
Project Properties—Resources tab
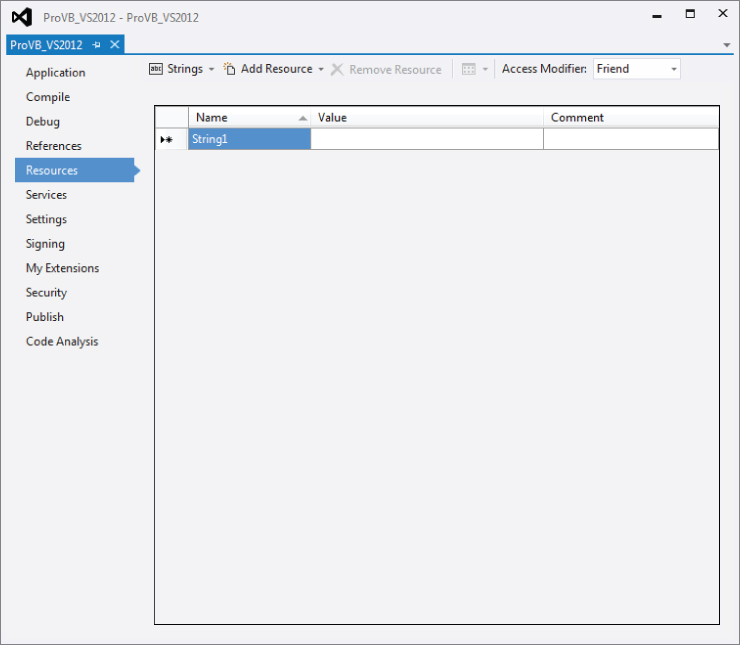
Note one little-known feature of this tab: Using the Add Resource drop-down button and selecting an image (not an existing image but one based on one of the available image types) will create a new image file and automatically open an image editor; this enables you to actually create the image that will be in the image file.
Additionally, within the list of Add Resource items, Visual Studio users can select or create a new icon. Choosing to create a new icon opens Visual Studio's icon editor, which provides a basic set of tools for creating custom icons to use as part of your application. This makes working with .ico files easier because you don't have to hunt for or purchase such files online; instead, you can create your own icons.
However, images aren't the only resources that you can embed with your executable. Resources also apply to the fixed text strings that your application uses. By default, people tend to embed this text directly into the source code so that it is easily accessible to the developer. Unfortunately, this leaves the application difficult to localize for use with a second language. The solution is to group all of those text strings together, thereby creating a resource file containing all of the text strings, which is still part of and easily accessible to the application source code. When the application is converted for use in another language, this list of strings can be converted, making the process of localization easier. Localization is covered in detail in Chapter 15.
Settings
Visual Studio provides significant support for application settings, including the Settings tab, shown in . This tab enables Visual Basic developers to identify application settings and automatically create these settings within the app.config file.
Project Properties—Settings tab
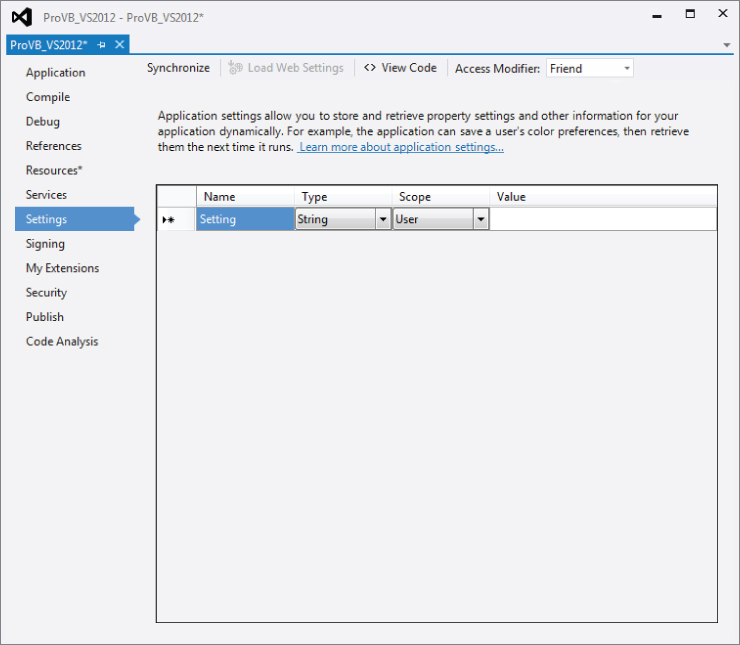
illustrates several elements related to the application settings capabilities of Visual Basic. The first setting is of type String. Under .NET 1.x, all application settings were seen as strings, and this was considered a weakness. Accordingly, the second setting, LastLocation, exposes the Type drop-down, illustrating that under you can now create a setting that has a well-defined type.
However, strongly typed settings are not the customizable attribute related to application settings. The very next column defines the scope of a setting. There are two possible options: application wide or user specific. The settings defined with application scope are available to all users of the application.
The alternative is a user-specific setting. Such settings have a default value; in this case, the last location defaults to 0,0. However, once a user has read that default setting, the application generally updates and saves the user-specific value for that setting. As indicated by the LastLocation setting, each user of the application might close it after having moved it to a new location on the screen; and the goal of such a setting would be to reopen the application where it was last located. Thus, the application would update this setting value, and Visual Basic makes it easy to do this, as shown in the following code:
My.Settings.LastLocation = Me.Location My.Settings.Save()
That's right—Visual Basic requires only two lines of code that leverage the My namespace in order for you to update a user's application setting and save the new value.
Visual Studio automatically generated all the XML needed to define these settings and save the default values. Note that individual user settings are not saved back into the config file, but rather to a user-specific working directory. In fact, it is possible not only to update application settings with Visual Basic, but also to arrange to encrypt those settings, although this behavior is outside the scope of this chapter.
Other Project Property Tabs
In addition to the tabs that have been examined in detail, there are other tabs which are more specific. In most cases these tabs are used only in specific situations that do not apply to all projects.
Signing
This tab is typically used in conjunction with deployment. If you are interested in creating a commercial application that needs to be installed on client systems, you'll want to sign your application. There are several advantages to signing your application, including the capability to publish it via ClickOnce deployment. Therefore, it is possible to sign an application with a developer key if you want to deploy an application internally.
My Extensions
The My Extensions tab enables you to create and leverage extensions to Visual Basic's My namespace. By default, Visual Studio 2012 ships with extensions to provide My namespace shortcuts for key WPF and Web applications.
Security
The Secutiry tab enables you to define the security requirements of your application for the purposes of ClickOnce deployment.
Publish
The Publish tab is used to configure and initiate the publishing of an application. From this tab you can update the published version of the application and determine where to publish it.
Code Analysis
This Code Analysis tab enables the developer to turn on and configure the static code analysis settings. These settings are used after compilation to perform automated checks against your code. Because these checks can take significant time, especially for a large project, they must be manually turned on.
illustrates the default view you see when your project template completes. On the screen is the design surface upon which you can drag controls from the Toolbox to build your user interface and update properties associated with your form. New WPF project Design view
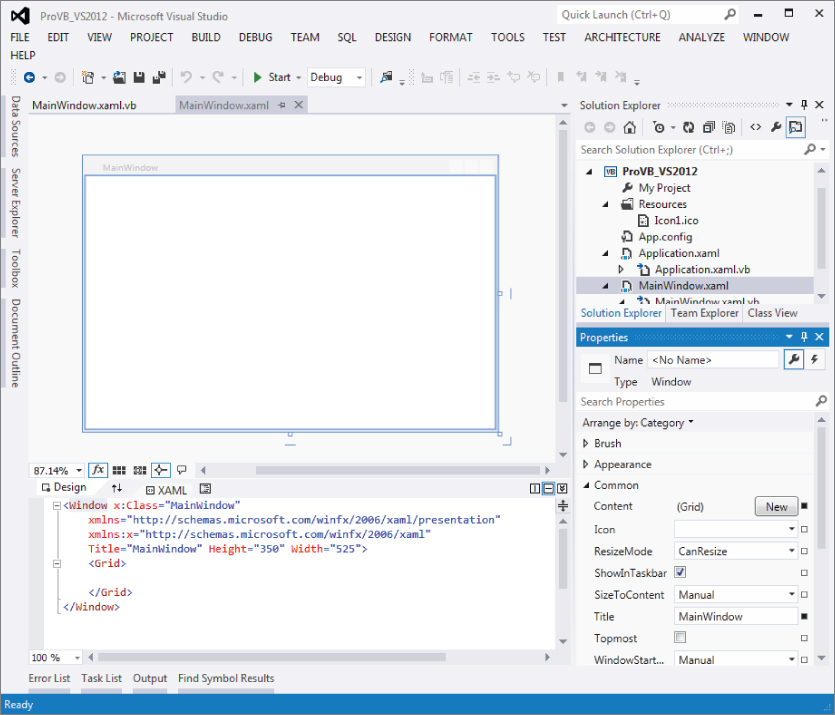
New WPF project Design view

The Properties pane, shown in more detail in , is by default placed in the lower-right corner of the Visual Studio window. Like many of the other windows in the IDE, if you close it, it can be accessed through the View menu. Alternatively, you can use the F4 key to reopen this window. The Properties pane is used to set the properties of the currently selected control, or for the Form as a whole.
Properties for Main Window
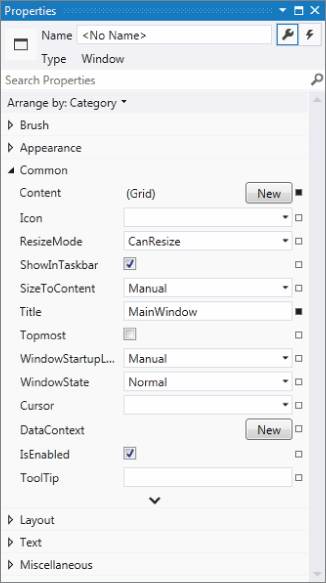
Each control you place on your form has its own distinct set of properties. For example, in the Design view, select your form. You'll see the Properties window adjust to display the properties of MainWindow (refer to ). This is the list of properties associated with your window. If you want to limit how small a user can reduce the display area of your form, then you can now define this as a property.
For your sample, go to the Title property and change the default of MainWindow to “ProVB 2012” Once you have accepted the property change, the new value is displayed as the caption of your form. In addition to your window frame, WPF has by default populated the body of your window with a Grid control. As you look to customize your new window, this grid will allow you to define regions of the page and control the layout of items within the window.
Tear-Away Tabs
You may have noticed in that the Code View and Form Designer windows open in a tabbed environment. This environment is the default for working with the code windows inside Visual Studio, but you can change this. As with any other window in Visual Studio, you can mouse down on the tab and drag it to another location.
What makes this especially useful is that you can drag a tab completely off of the main window and have it open as a standalone window elsewhere. Thus, you can take the current source file you are editing and drag it to a monitor that is separate from the remainder of Visual Studio—examples of this are the Project Properties shown earlier in this chapter in Figures through . If you review those images you'll see that they are not embedded within the larger Visual Studio frame but have been pulled out into their own window. This feature can be very useful when you want to have another source file from your application open either for review or reference while working in a primary file.
Running ProVB_VS2012
You've looked at the form's properties, so now is a good time to open the code associated with this file by either double clicking the file MainWindow.xaml.vb, or right-clicking MainWindow in the Solution Explorer and selecting Code view, or right-clicking the form in the Design view and selecting View Code from the pop-up menu. The initial display of the code is simple. There is no implementation code beyond the class definition in the MainWindows.xaml.vb file.
So before continuing, let's test the generated code. To run an application from within Visual Studio, you have several options; the first is to click the Start button, which looks like the Play button on any media device. Alternatively, you can go to the Debug menu and select Start. Finally, the most common way of launching applications is to press F5.
Once the application starts, an empty form is displayed with the standard control buttons (in the upper-right corner) from which you can control the application. The form name should be ProVB 2012, which you applied earlier. At this point, the sample doesn't have any custom code to examine, so the next step is to add some simple elements to this application.
Customizing the Text Editor
In addition to being able to customize the overall environment provided by Visual Studio, you can customize several specific elements related to your development environment. Visual Studio's user interface components have been rewritten using WPF so that the entire display provides a much more graphical environment and better designer support.
Visual Studio provides a rich set of customizations related to a variety of different environment and developer settings. To leverage Visual Studio's settings, select Tools ⇒ Options to open the Options dialog, shown in . To match the information shown in select the Text Editor folder, and then the All Languages folder. These settings apply to the text editor across every supported development language. Additionally, you can select the Basic folder, the settings (not shown) available at that level are specific to how the text editor behaves when you edit VB source code.
Visual Studio Options dialogue
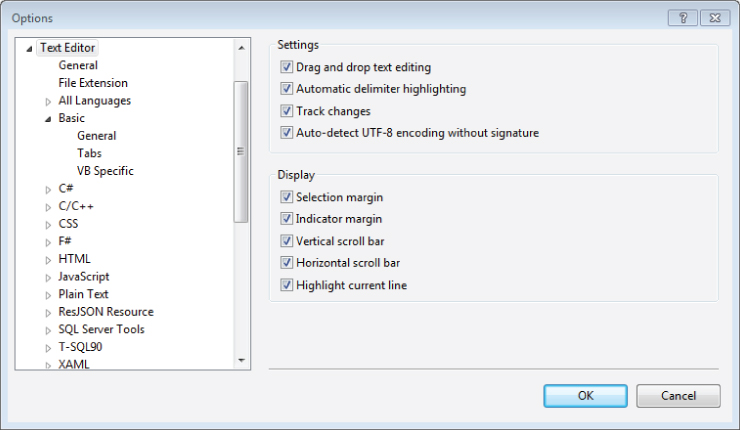
From this dialogue, it is possible to modify the number of spaces that each tab will insert into your source code and to manage several other elements of your editing environment. Within this dialogue you see settings that are common for all text editing environments, as well as the ability to customize specific settings for specific languages. For example, the section specific to Visual Basic includes settings that allow for word wrapping and line numbers. One little-known but useful capability of the text editor is line numbering. Checking the Line numbers check box will cause the editor to number all lines, which provides an easy way to unambiguously reference lines of code.
Visual Studio also provides a visual indicator so you can track your changes as you edit. Enabling the Track changes setting under the Text Editor options causes Visual Studio to provide a colored indicator in places where you have modified a file. This indicator appears as a colored bar at the left margin of your display. It shows which portions of a source file have been recently edited and whether those changes have been saved to disk.
) is docked to the left side of Visual Studio as a tab. When you click this tab, the control window expands, and you can drag controls onto your form. Alternatively, if you have closed the Toolbox tab, you can go to the View menu and select Toolbox. Visual Studio with sample ProVB_VS2012 in the designer
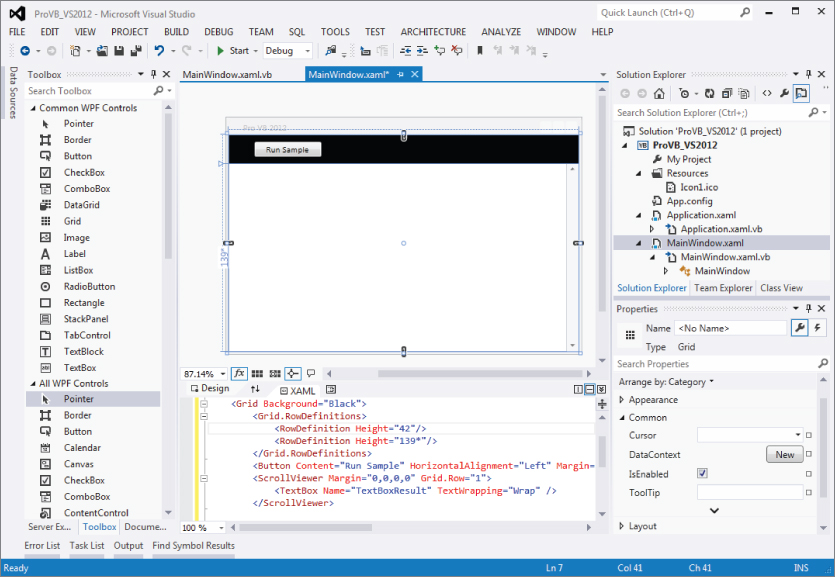
Visual Studio with sample ProVB_VS2012 in the designer

If you haven't set up the Toolbox to be permanently visible, it will slide out of the way and disappear whenever focus is moved away from it. This helps maximize the available screen real estate. If you don't like this feature (and you won't while working to add controls) you can make the Toolbox permanently visible by clicking the pushpin icon on the Toolbox's title bar.
By default the Toolbox contains the standard controls. All controls loaded in the Toolbox are categorized so it's easier to find them. Before customizing the first control added to this form, take a closer look at the Visual Studio Toolbox. The tools are broken out by category, but this list of categories isn't static. Visual Studio allows you to create your own custom controls. When you create such controls, the IDE will—after the controls have been compiled—automatically add them to the display when you are working in the same solution as the controls. These would be local references to controls that become available within the current solution.
Additionally, depending on whether you are working on a Web or a Windows Forms application, your list of controls in the Toolbox will vary. Windows Forms has a set of controls that leverages the power of the Windows operating system. Web applications, conversely, tend to have controls oriented to working in a disconnected environment.
It's also possible to have third-party controls in your environment. Such controls can be registered with Visual Studio and are then displayed within every project you work on. When controls are added to the Toolbox they typically appear in their own custom categories so that they are grouped together and therefore easy to find.
Next, go to the Toolbox and drag a button onto the top row of the display that you created earlier. Now take a scroll viewer and deposit it within the bottom section of the grid. For the next step you're going to go to the XAML, which is below your Design view. The design will have assigned a group of properties, and your first task is to remove most of these. Your XAML should include a line similar to the following:
<ScrollViewer HorizontalAlignment="Left" Height="100" Margin="138,80,0,0" Grid.Row="1" VerticalAlignment="Top" Width="100"/>
You want to transform that line into one that looks like the following:
<ScrollViewer Margin="0,0,0,0" Grid.Row="1"></ScrollViewer>
Notice that you've modified the values for the Margin to be all zero. Additionally, instead of the XML being a self-terminating declaration, you've separated out the termination of the XML.
You'll see that the border of the control now fills the lower section of your display. That means the scroll view control is now ready to have a textbox placed on it. Drag and drop one from the Toolbox, and you'll see your XAML transform to include the following line—and it should have appeared before the start and end tags for the scroll viewer you just added.
<TextBox Height="23" TextWrapping="Wrap" Text="TextBox" Width="120"/>
Once again you are going to edit this line of XML to simplify it. In this case you want to remove the size attributes and default contents and provide a name for your textbox control so you can reference it from code. The result should be something similar to the following line of XML.
<TextBox Name="TextBoxResult" TextWrapping="Wrap" />
Finally, select the button you originally dropped on the form. Go to the Properties window and select the Common category. The first property in that category should be Content, and you want to set the label to “Run Sample.” Once you've done this, resize the button to display your text. At this point your form should look similar to what is seen in , introduced earlier in this chapter.
Return to the button you've dragged onto the form. It's ready to go in all respects—however, Visual Studio has no way of knowing what you want to happen when it is used. Having made these changes, double-click the button in the Display view. Double-clicking tells Visual Studio that you want to add an event handler to this control, and by default Visual Studio adds an On_Click event handler for buttons. The IDE then shifts the display to the Code view so that you can customize this handler. Notice that you never provided a name for the button. It doesn't need one—the hook to this handler is defined in the XAML, and as such there is no reason to clutter the code with an extra control name.
Customizing the Code
With the code window open to the newly added event handler for the Button control, you can start to customize this handler. Although the event handler can be added through the designer, it's also possible to add event handlers from Code view. After you double-clicked the button, Visual Studio transferred you to Code view and displayed your new event handler. Notice that in Code view there are drop-down lists on the top of the edit window. The boxes indicate the current “named” object on the left—in this case, your main window—and the current method on the right—in this case, the click event handler. You can add new handlers for other events for the selected object using these drop-down lists.
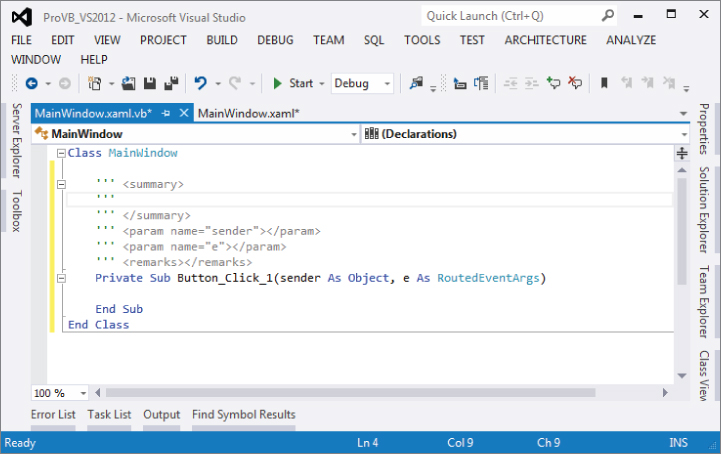
The drop-down list on the left side contains only those objects which have been named. Thus, your button isn't listed, but the first named parent for that control is selected: MainWindow. While you can create events for unnamed controls, you can only create handlers in code for named objects. The drop-down list on the right side contains all the events for the selected object only. For now, you have created a new handler for your button's click event, so now you can customize the code associated with this event. shows the code for this event handler with generated XML Comments.
Button_Click_1 event handler
Adding XML Comments
One of Visual Studio's features is the capability to generate an XML comments template for Visual Basic. XML comments are a much more powerful feature than you might realize, because they are also recognized by Visual Studio for use in IntelliSense. To add a new XML comment to your handler, go to the line before the handler and type three single quotation marks: ‘'’. This triggers Visual Studio to replace your single quotation marks with the following block of comments. You can trigger these comments in front of any method, class, or property in your code.
''' <summary> ''' ''' </summary> ''' <param name="sender"></param> ''' <param name="e"></param> ''' <remarks></remarks>
Visual Studio provides a template that offers a place to include a summary of what this method does. It also provides placeholders to describe each parameter that is part of this method. Not only are the comments entered in these sections available within the source code, when it's compiled you'll also find an XML file in the project directory, which summarizes all your XML comments and can be used to generate documentation and help files for the said source code. By the way, if you refactor a method and add new parameters, the XML comments also support IntelliSense for the XML tags that represent your parameters.
IntelliSense, Code Expansion, and Code Snippets
One of the reasons why Microsoft Visual Studio is such a popular development environment is because it was designed to support developer productivity. People who are unfamiliar with Visual Studio might just assume that “productivity” refers to organizing and starting projects. Certainly, as shown by the project templates and project settings discussed so far, this is true, but those features don't speed your development after you've created the project.
This section covers three features that target your productivity while writing code. They are of differing value and are specific to Visual Studio. The first, IntelliSense, has always been a popular feature of Microsoft tools and applications. The second feature, code expansion, is another popular feature available since Visual Studio 2005. It enables you to type a keyword, such as “select,” and then press the Tab key to automatically insert a generic select-case code block which you can then customize. Finally, going beyond this, you can use the right mouse button and insert a code snippet at the location of your mouse click. As you can tell, each of these builds on the developer productivity capabilities of Visual Studio.
IntelliSense
Early versions of IntelliSense required you to first identify a class or property in order to make uses of the IntelliSense feature. Now IntelliSense is activated with the first letter you type, so you can quickly identify classes, commands, and keywords that you need.
Once you've selected a class or keyword, IntelliSense continues, enabling you to not only work with the methods of a class, but also automatically display the list of possible values associated with an enumerated list of properties when one has been defined. IntelliSense also provides a tooltip-like list of parameter definitions when you are making a method call.
illustrates how IntelliSense becomes available with the first character you type. Also note that the drop-down window has two tabs on the bottom: one is optimized for the items that you are likely to want, while the other shows you everything that is available. In addition, IntelliSense works with multiword commands. For example, if you type Exit and a space, IntelliSense displays a drop-down list of keywords that could follow Exit. Other keywords that offer drop-down lists to present available options include Goto, Implements, Option, and Declare. In most cases, IntelliSense displays more tooltip information in the environment than in past versions of Visual Studio, and helps developers match up pairs of parentheses, braces, and brackets.
IntelliSense in action
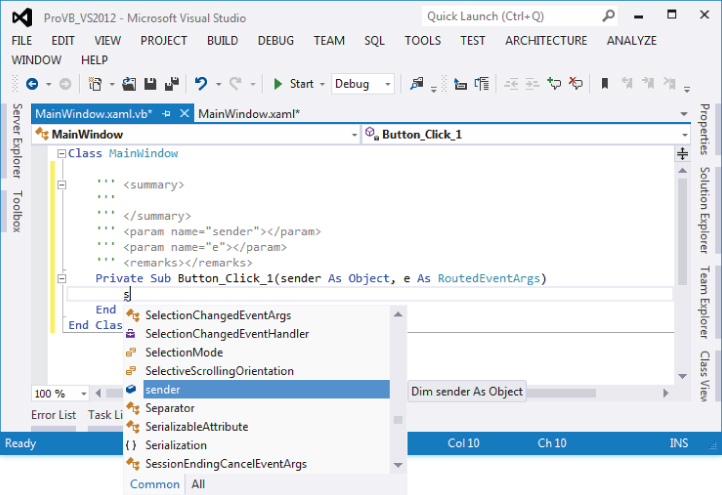
Finally, note that IntelliSense is based on your editing context. While editing a file, you may reach a point where you are looking for a specific item to show up in IntelliSense, but when you repeatedly type slightly different versions, nothing appears. IntelliSense recognizes that you aren't in a method or you are outside of the scope of a class, so it removes items that are inappropriate for the current location in your source code from the list of items available from IntelliSense.
Code Expansion
Going beyond IntelliSense is code expansion. Code expansion recognizes that certain keywords are consistently associated with other lines of code. At the most basic level, this occurs when you declare a new Function or Sub: Visual Studio automatically inserts the End Sub or End Function line once you press Enter. Essentially, Visual Studio is expanding the declaration line to include its matching endpoint.
However, true code expansion goes further than this. With true code expansion, you can type a keyword such as For, ForEach, Select, or any of a number of Visual Basic keywords. If you then use the Tab key, Visual Studio will attempt to recognize that keyword and insert the block of code that you would otherwise need to remember and type yourself. For example, instead of needing to remember how to format the control values of a Select statement, you can just type the first part of the command Select and then press Tab to get the following code block:
Select Case VariableName Case 1 Case 2 Case Else End Select
Unfortunately, this is a case where just showing you the code isn't enough. That's because the code that is inserted has active regions within it that represent key items you will customize. Thus, provides a better representation of what is inserted when you expand the Select keyword into a full Select Case statement.
Expanded Select Case statement
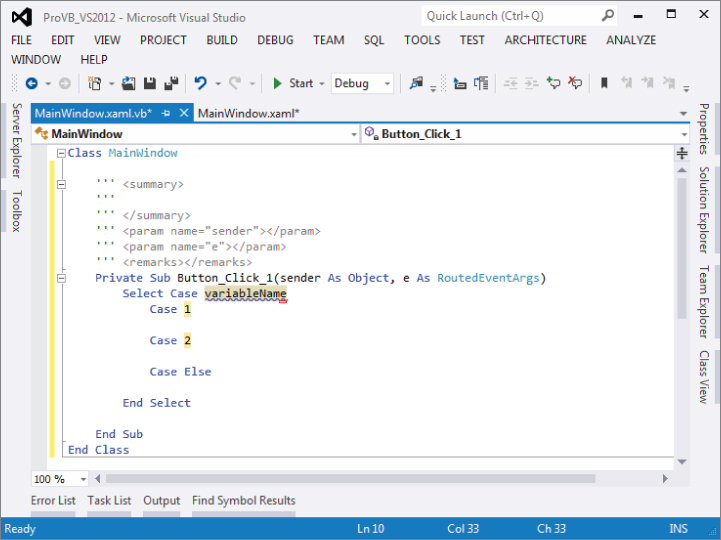
When the block is inserted, the editor automatically positions your cursor in the first highlighted block—VariableName. When you start typing the name of the variable that applies, the editor automatically clears that static VariableName string, which is acting as a placeholder. Once you have entered the variable name you want, you can just press Tab. At that point the editor automatically jumps to the next highlighted item. This capability to insert a block of boilerplate code and have it automatically respond to your customization is extremely useful. However, this code isn't needed in the sample. Rather than delete, it use the Ctrl+Z key combination to undo the addition of this Select statement in your code.
Code expansion enables you to quickly shift between the values that need to be customized, but these values are also linked where appropriate, as in the next example. Another code expansion shortcut creates a new property in a class. Position the cursor above your generated event handler to add a custom property to this form. Working at the class level, when you type the letters prop and then press the Tab key twice, code expansion takes over. After the first tab you'll find that your letters become the word “Property,” and after the second tab the code shown in will be added to your existing code. On the surface this code is similar to what you see when you expand the Select statement. Note that although you type prop, even the internal value is part of this code expansion. Furthermore, Visual Basic implemented a property syntax that is dependent on an explicit backing field. For simplicity, you may not use a backing field on every property, but it's good to see how this expansion provides the more robust backing-field-supported syntax for a property.
Editing a newly created property in Visual Studio
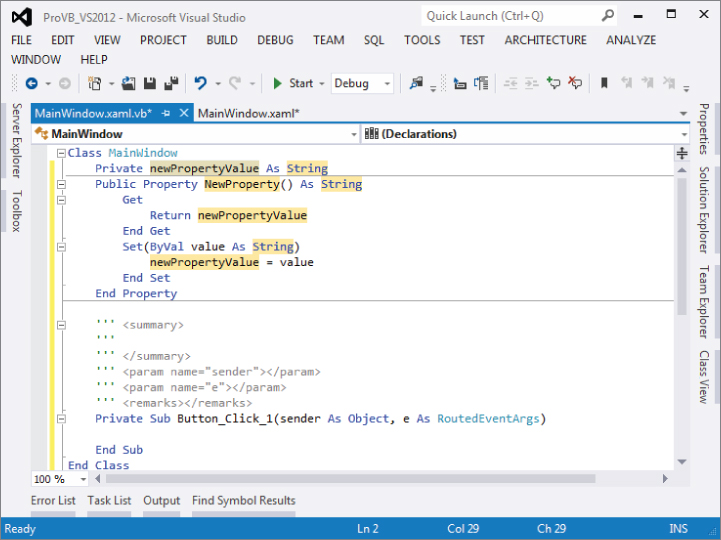
Notice how the same value String in is repeated for the property. The value you see is the default. However, when you change the first such entry from String to Integer, Visual Studio automatically updates all three locations because it knows they are linked. Using the code shown in , update the property value to be m_Count. Press Tab and change the type to Integer; press Tab again and label the new property Count. Keep in mind this is a temporary state—once you've accepted this template, the connections provided by the template are lost. Once you are done editing, you now have a simple property on this form for use later when debugging.
The completed code should look like the following block:
Private m_Count As Integer Public Property Count() As Integer Get Return m_Count End Get Set(ByVal value As Integer) m_Count = value End Set End Property
This capability to fully integrate the template supporting the expanded code with the highlighted elements, helping you navigate to the items you need to edit, makes code expansion such a valuable tool.
Code Snippets
With a click of your mouse you can browse a library of code blocks, which, as with code expansion, you can insert into your source file. However, unlike code expansion, these snippets aren't triggered by a keyword. Instead, you right-click and—as shown in —select Insert Snippet from the context menu. This starts the selection process for whatever code you want to insert.
Preparing to insert a snippet
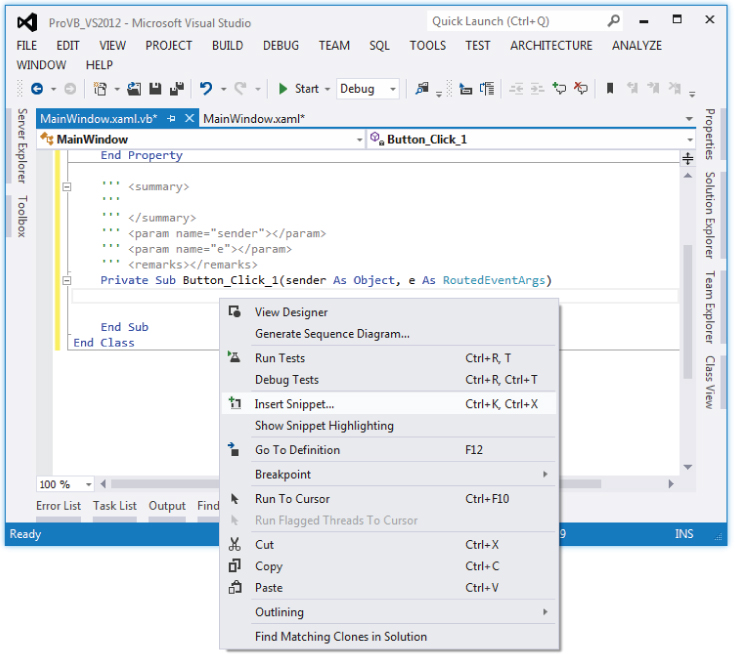
The snippet library, which is installed with Visual Studio, is fully expandable, as discussed later in this chapter. Snippets are categorized by the function on which each is focused. For example, all the code you can reach via code expansion is also available as snippets, but snippets go well beyond that list. There are snippet blocks for XML-related actions, for operating system interface code, for items related to Windows Forms, and, of course, a lot of data-access-related blocks. Unlike code expansion, which enhances the language in a way similar to IntelliSense, code snippets are blocks of code focused on functions that developers often write from scratch.
As shown in , the insertion of a snippet triggers the creation of a placeholder tag and a context window showing the categories of snippets. Each of the folders can contain a combination of snippet files or subdirectories containing still more snippet files. In addition, Visual Studio includes the folder My Code Snippets, to which you can add your own custom snippet files.
Selecting the category of snippet
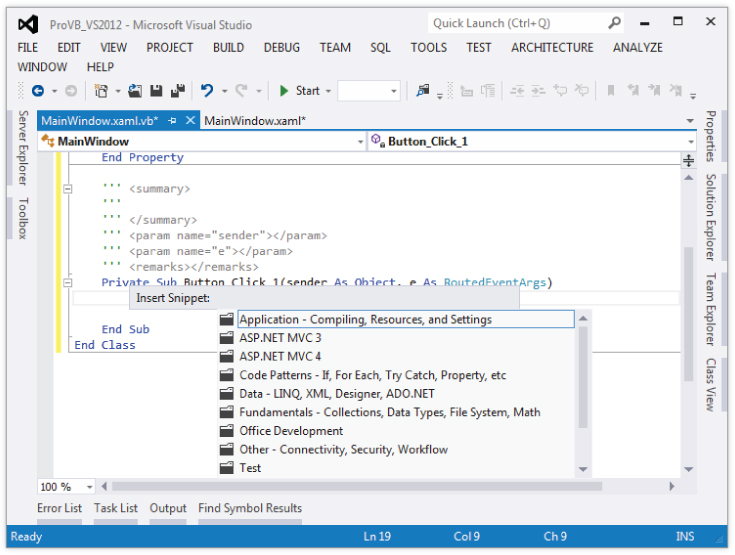
Selecting a folder enables you to select from one of its subfolders or a snippet file. Once you select the snippet of interest, Visual Studio inserts the associated code into your source file. shows the result of adding an operating system snippet to some sample code. The selected snippet was Windows System—Logging, Processes, Registry, Services ⇒ Windows—Event Logs ⇒ Read Entries Created by a Particular Application from the Event Log.
Viewing the snippet code
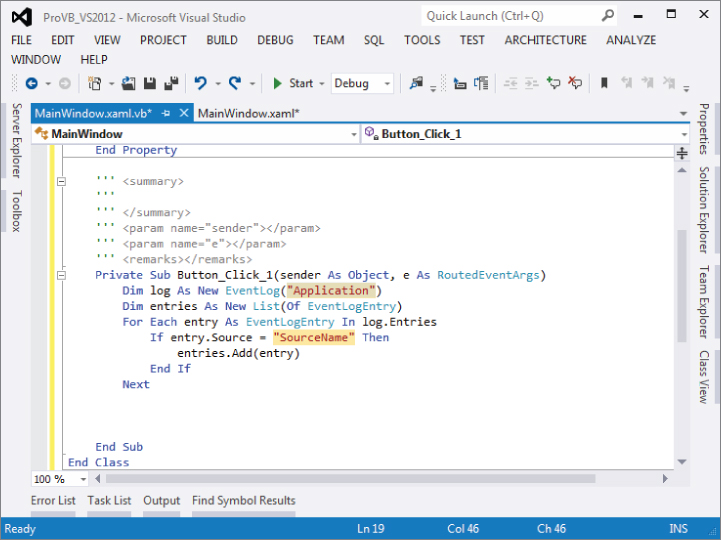
As you can see, this code snippet is specific to reading the Application Log. This snippet is useful because many applications log their errors to the Event Log so that they can be reviewed either locally or from another machine in the local domain. The key, however, is that the snippet has pulled in the necessary class references, many of which might not be familiar to you, and has placed them in context. This reduces not only the time spent typing this code, but also the time spent recalling exactly which classes need to be referenced and which methods need to be called and customized.
Finally, it is also possible to shortcut the menu tree. Specifically, if you know the shortcut for a snippet, you can type that and then press Tab to have Visual Studio insert the snippet. For example, typing evReadApp followed by pressing Tab will insert the same snippet shown in .
Tools such as code snippets and especially code expansion are even more valuable when you work in multiple languages. Keep in mind, however, that Visual Studio isn't limited to the features that come in the box. It's possible to extend Visual Studio not only with additional controls and project templates, but also with additional editing features. Once again this code was merely for demonstration, and you shouldn't keep this snippet within your event handler.
Code Regions
Source files in Visual Studio allow you to collapse blocks of code. The idea is that in most cases you can reduce the amount of onscreen code, which seems to separate other modules within a given class, by collapsing the code so it isn't visible; this feature is known as outlining. For example, if you are comparing the load and save methods and you have several other blocks of code, then you can effectively “hide” this code, which isn't part of your current focus.
By default, there is a minus sign next to every method (sub or function). This makes it easy to hide or show code on a per-method basis. If the code for a method is hidden, the method declaration is still shown and has a plus sign next to it indicating that the body code is hidden. This feature is very useful when you are working on a few key methods in a module and you want to avoid scrolling through many screens of code that are not relevant to the current task.
It is also possible to create custom regions of code so you can hide and show portions of your source files. For example, it is common to see code where all of the properties are placed in one region, and all of the public methods are placed in another. The #Region directive is used for this within the IDE, though it has no effect on the actual application. A region of code is demarcated by the #Region directive at the beginning and the #End Region directive at the end. The #Region directive that is used to begin a region should include a description that appears next to the plus sign shown when the code is minimized.
The outlining enhancement was in part inspired by the fact that the original Visual Studio designers generated a lot of code and placed all of this code in the main .vb file for that form. It wasn't until Visual Studio 2005 and partial classes that this generated code was placed in a separate file. Thus, the region allowed the generated code section to be hidden when a source file was opened.
Being able to see the underpinnings of your generated UI does make it is easier to understand what is happening, and possibly to manipulate the process in special cases. However, as you can imagine, it can become problematic; hence the #Region directive, which can be used to organize groups of common code and then visually minimize them.
Visual Studio developers can also control outlining throughout a source file. Outlining can be turned off by selecting Edit ⇒ Outlining ⇒ Stop Outlining from the Visual Studio menu. This menu also contains some other useful functions. A section of code can be temporarily hidden by highlighting it and selecting Edit ⇒ Outlining ⇒ Hide Selection. The selected code will be replaced by ellipses with a plus sign next to it, as if you had dynamically identified a region within the source code. Clicking the plus sign displays the code again.
Customizing the Event Handler
At this point you should customize the code for the button handler, as this method doesn't actually do anything yet. Start by adding a new line of code to increment the property Count you added to the form earlier. Next, use the System.Windows.MessageBox class to open a message box and show the message indicating the number of times the Hello World button has been pressed. Fortunately, because that namespace is automatically imported into every source file in your project, thanks to your project references, you can reference the MessageBox.Show method directly. The Show method has several different parameters and, as shown in , not only does the IDE provide a tooltip for the list of parameters, it also provides help regarding the appropriate value for individual parameters.
Using IntelliSense to the fullest
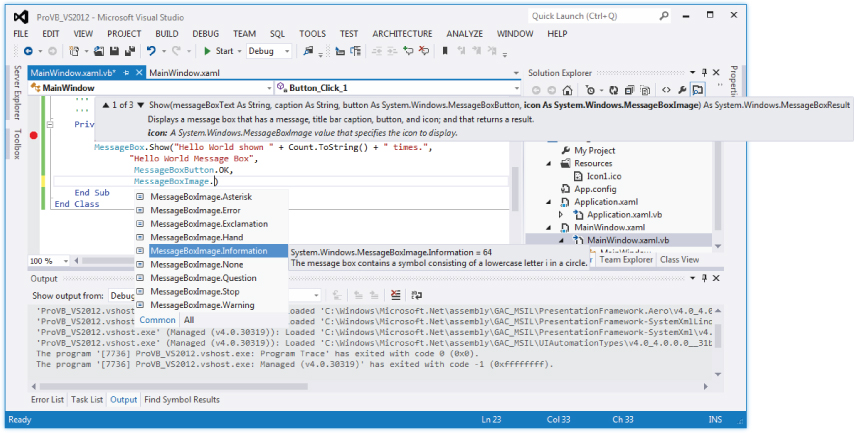
The completed call to MessageBox.Show should look similar to the following code block. Note that the underscore character is used to continue the command across multiple lines. In addition, unlike previous versions of Visual Basic, for which parentheses were sometimes unnecessary, in .NET the syntax best practice is to use parentheses for every method call:
     Private Sub Button_Click_1(sender As Object, e As RoutedEventArgs)           Count += 1           MessageBox.Show("Hello World shown " + Count.ToString() + " times.",                  "Hello World Message Box",                   MessageBoxButton.OK,                   MessageBoxImage.Information)
      End Sub
Once you have entered this line of code, you may notice a squiggly line underneath some portions of your text. This occurs when there is an error in the line you have typed. The Visual Studio IDE works more like the latest version of Word—it highlights compiler issues while allowing you to continue working on your code. Visual Basic is constantly reviewing your code to ensure that it will compile, and when it encounters a problem it immediately notifies you of the location without interrupting your work.
Reviewing the Code
The custom code for this project resides in two source files. The first is the definition of the window, MainWindows.xaml. displays the final XAML for this file. Note your Grid.RowDefinition probably varies from what you'll see in the final listing.
: XAML for main window—MainWindow.xaml
<Window x:Class="MainWindow" xmlns="http://schemas.microsoft.com/winfx/2006/xaml/presentation" xmlns:x="http://schemas.microsoft.com/winfx/2006/xaml" Title="Pro VB 2012" Height="350" Width="525"> <Grid Background="Black"> <Grid.RowDefinitions> <RowDefinition Height="42"/> <RowDefinition Height="139*"/> </Grid.RowDefinitions> <Button Content="Run Sample" HorizontalAlignment="Left" Margin="37,10,0,0" VerticalAlignment="Top" Width="100" Height="22" Click="Button_Click_1"/> <ScrollViewer Margin="0,0,0,0" Grid.Row="1"> <TextBox Name="TextBoxResult" TextWrapping="Wrap" /> </ScrollViewer> </Grid> </Window>
This XAML reflects the event handler added for the button. The handler itself is implemented in the accompanying code-behind file MainWindow.xaml.vb. That code is shown in and contains the custom property and the click event handler for your button.
: Visual Basic code for main window—MainWindow.xaml.vb
Class MainWindow Private m_Count As Integer Public Property Count() As Integer Get Return m_Count End Get Set(ByVal value As Integer) m_Count = value End Set End Property ''' <summary> ''' ''' </summary> ''' <param name="sender"></param> ''' <param name="e"></param> ''' <remarks></remarks> Private Sub Button_Click_1(sender As Object, e As RoutedEventArgs) Count += 1 MessageBox.Show("Hello World shown " + Count.ToString() + " times.", "Hello World Message Box", MessageBoxButton.OK, MessageBoxImage.Information) End Sub End Class At this point, you can test the application, but to do so let's first look at your build options.
Building Applications
For this example, it is best to build your sample application using the Debug build configuration. The first step is to ensure that Debug is selected as the active configuration. As noted earlier in this chapter around , you'll find the setting available on your project properties. It's also available from the main Visual Studio display as a drop-down list box that's part of the Standard Toolbar. Visual Studio provides an entire Build menu with the various options available for building an application. There are essentially three options for building applications:
The Build menu supports building for either the current project or the entire solution. Thus, you can choose to build only a single project in your solution or all of the projects that have been defined as part of the current configuration. Of course, anytime you choose to test-run your application, the compiler will automatically perform a compilation check to ensure that you run the most recent version of your code.
You can either select Build from the menu or use the Ctrl+Shift+B keyboard combination to initiate a build. When you build your application, the Output window along the bottom edge of the development environment will open. As shown in , it displays status messages associated with the build process. This window should indicate your success in building the application.
Build window

If problems are encountered while building your application, Visual Studio provides a separate window to help track them. If an error occurs, the Task List window will open as a tabbed window in the same region occupied by the Output window (refer to ). Each error triggers a separate item in the Task List. If you double-click an error, Visual Studio automatically repositions you on the line with the error. Once your application has been built successfully, you can run it, and you will find the executable file located in the targeted directory. By default, for .NET applications this is the \bin subdirectory of your project directory.
Running an Application in the Debugger
As discussed earlier, there are several ways to start your application. Starting the application launches a series of events. First, Visual Studio looks for any modified files and saves those files automatically. It then verifies the build status of your solution and rebuilds any project that does not have an updated binary, including dependencies. Finally, it initiates a separate process space and starts your application with the Visual Studio debugger attached to that process.
When your application is running, the look and feel of Visual Studio's IDE changes, with different windows and button bars becoming visible (see ). Most important, and new to Visual Studio 2012, the bottom status bar goes from blue to orange to help provide a visual indicator of the change in status.
Stopped at a breakpoint while debugging
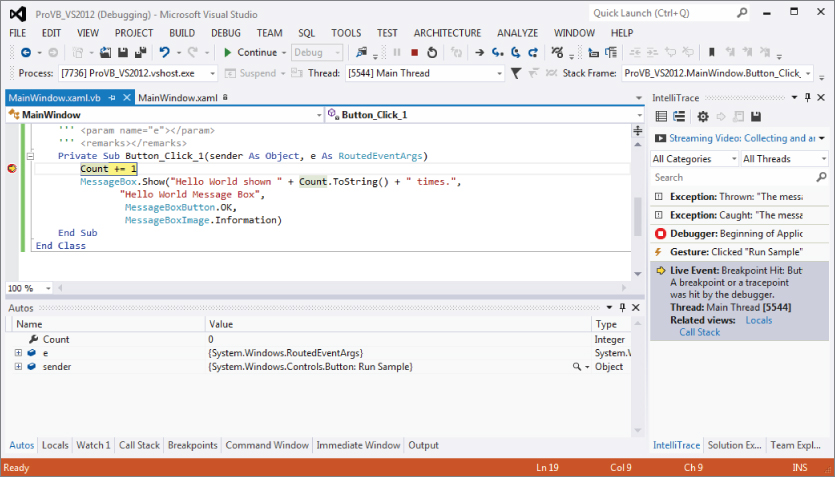
While your code remains visible, the IDE displays additional windows—by default, the Immediate Window appears as a new tabbed window in the same location as the Output Window. Others, such as the Call Stack, Locals, and Watch windows, may also be displayed over time as you work with the debugger. These windows are used by you, the real debugger, for reviewing the current value of variables within your code.
The true power of the Visual Studio debugger is its interactive debugging. To demonstrate this, with your application running, select Visual Studio as the active window. Change your display to the MainWindow.xaml.vb Code view (not Design view) and click in the border alongside the line of code you added to increment the count when the button is clicked. Doing this creates a breakpoint on the selected line (refer to ). Return to your application and then click the “Run Sample” button. Visual Studio takes the active focus, returning you to the code window, and the line with your breakpoint is now selected.
Visual Studio 2010 introduced a new window that is located in the same set of tabs as the Solution Explorer. As shown in , the IntelliTrace window tracks your actions as you work with the application in Debug mode. focuses on this new feature available to the Ultimate edition of Visual Studio. Sometimes referred to as historical debugging, the IntelliTrace window provides a history of how you got to a given state.
IntelliTrace display at a breakpoint
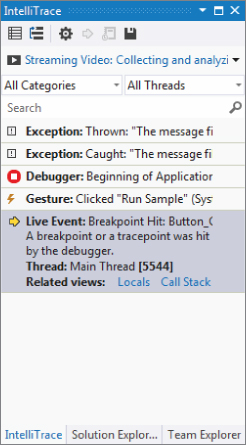
When an error occurs during debugging, your first thought is likely to be “What just happened?” But how do you reproduce that error? As indicated in , the IntelliTrace window tracks the steps you have taken—in this case showing that you had used the Run Code button a second time since the steps shown in . By providing a historical trail, IntelliTrace enables you to reproduce a given set of steps through your application. You can also filter the various messages either by message type or by thread.
The ability to select these past breakpoints and review the state of variables and classes in your running application can be a powerful tool for tracking down runtime issues. The historical debugging capabilities are unfortunately only available in Visual Studio Ultimate, but they take the power of the Visual Studio debugger to a new level.
However, even if you don't have the power of historical debugging, the Visual Studio debugger is a powerful development ally. It is, arguably, more important than any of the other developer productivity features of Visual Studio. With the execution sitting on this breakpoint, it is possible to control every aspect of your running code. Hovering over the property Count, as shown in , Visual Studio provides a debug tooltip showing you the current value of this property. This “hover over” feature works on any variable in your local environment and is a great way to get a feel for the different values without needing to go to another window.
Using a debug tooltip to display the current value of a variable
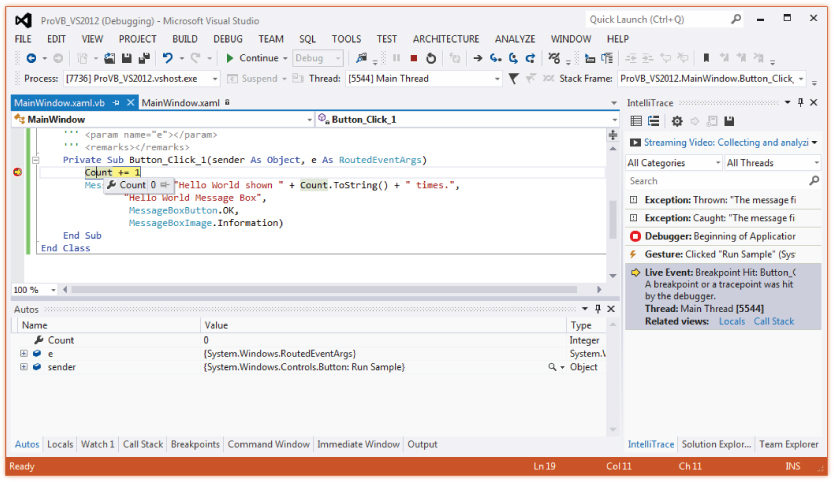
Windows such as Locals and Autos display similar information about your variables, and you can use these to update those properties while the application is running. However, you'll note that the image in includes a small pin symbol. Using this, you can keep the status window for this variable open in your Code view. Using this will allow you to see the information in the debug window update to show the new value of Count every time the breakpoint is reached.
This isn't the end of it. By clicking on the down arrows you see on the right-hand side of your new custom watch window, just below the pin, you can add one or more comments to your custom watch window for this value. You also have the option to unpin the initial placement of this window and move it off of your Code view display. Not only that, but the custom watch window is persistent in Debug mode. If you stop debugging and restart, the window is automatically restored and remains available until you choose to close it using the close button.
Next, move your mouse and hover over the parameter sender. This will open a window similar to the one for Count and you can review the reference to this object. However, note the small plus sign on the right-hand side, which if clicked expands the pop-up to show details about the properties of this object. As shown in , this capability is available even for parameters like sender, which you didn't define. also illustrates a key point about looking at variable data. Notice that by expanding the top-level objects you can eventually get to the properties inside those objects. Within some of those properties on the right-hand side is a little magnifying glass icon. That icon tells you that Visual Studio will open the potentially complex value in any one of up to four visualization tool windows. When working with complex XML or other complex data, these visualizers offer significant productivity benefits by enabling you to review data.
Delving into sender and selecting a visualizer
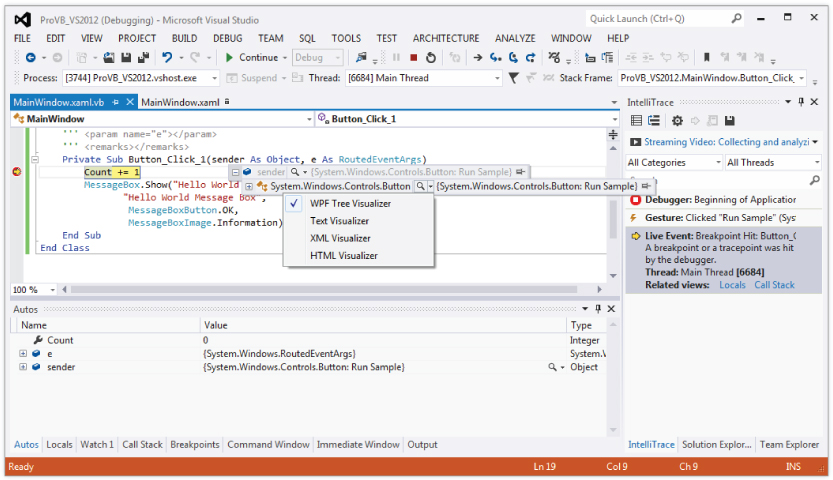
Once you are at a breakpoint, you can control your application by leveraging the Debug buttons on the Standard toolbar. These buttons, shown in , provide several options for managing the flow of your application. One of the main changes to Visual Studio 2012 is in fact the layout of the buttons and options visible within the IDE. This is one of those situations: in the past the debug buttons were grouped, but now there are several other buttons that sit between the various actions. From the left you see the Start/Continue button. Then a little further over in about the center of the image is the square that represents stop. It's colored red, and next to it is the icon to restart debugging. Finally, on the far right the last three buttons that use arrows represent Step-In, Step Over, and Step Out, respectively.
Toolbar buttons used in debugging

Step-In tells the debugger to jump to whatever line of code is first within the next method or property you call. Keep in mind that if you pass a property value as a parameter to a method, then the first such line of code is in the Get method of the parameter. Once there, you may want to step out. Stepping out of a method tells the debugger to execute the code in the current method and return you to the line that called the method. Thus, you could step out of the property and then step in again to get into the method you are actually interested in debugging.
Of course, sometimes you don't want to step into a method; this is where the Step-Over button comes in. It enables you to call whatever method(s) are on the current line and step to the next sequential line of code in the method you are currently debugging. The final button, Step-Out, is useful if you know what the code in a method is going to do, but you want to determine which code called the current method. Stepping out takes you directly to the calling code block.
Each of the buttons shown on the debugging toolbar in has an accompanying shortcut key for experienced developers who want to move quickly through a series of breakpoints.
Of course, the ability to leverage breakpoints goes beyond what you can do with them at runtime. You can also disable breakpoints that you don't currently want to stop your application flow, and you can move a breakpoint, although it's usually easier to just click and delete the current location, and then click and create a new breakpoint at the new location.
Visual Studio provides additional properties for managing and customizing breakpoints. As shown in , it's also possible to add specific properties to your breakpoints. The context menu shows several possible options.
Customizing a breakpoint
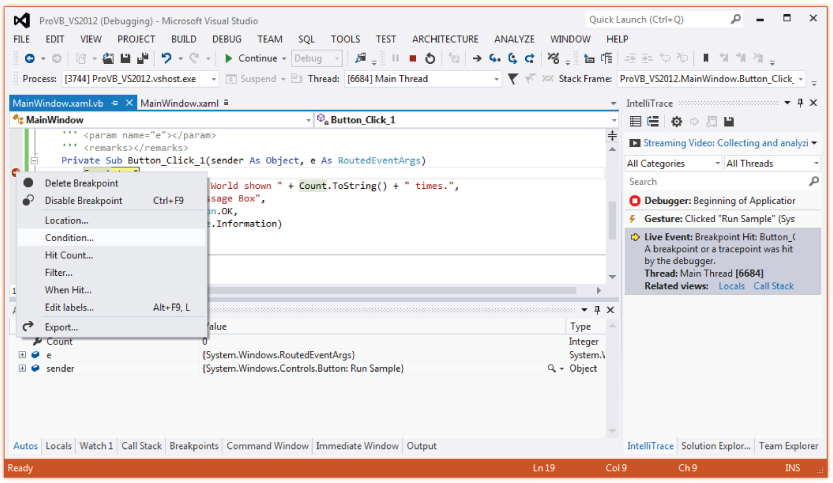
More important, it's possible to specify that a given breakpoint should execute only if a certain value is defined (or undefined). In other words, you can make a given breakpoint conditional, and a pop-up window enables you to define this condition. Similarly, if you've ever wanted to stop, for example, on the thirty-seventh iteration of a loop, then you know the pain of repeatedly stopping at a breakpoint inside a loop. Visual Studio enables you to specify that a given breakpoint should stop your application only after a specified number of hits.
The next option is one of the more interesting options if you need to carry out a debug session in a live environment. You can create a breakpoint on the debug version of code and then add a filter that ensures you are the only user to stop on that breakpoint. For example, if you are in an environment where multiple people are working against the same executable, then you can add a breakpoint that won't affect the other users of the application.
Similarly, instead of just stopping at a breakpoint, you can also have the breakpoint execute some other code, possibly even a Visual Studio macro, when the given breakpoint is reached. These actions are rather limited and are not frequently used, but in some situations this capability can be used to your advantage.
Note that breakpoints are saved when a solution is saved by the IDE. There is also a Breakpoints window, which provides a common location for managing breakpoints that you may have set across several different source files.
Finally, at some point you are going to want to debug a process that isn't being started from Visual Studio—for example, if you have an existing website that is hosting a DLL you are interested in debugging. In this case, you can leverage Visual Studio's capability to attach to a running process and debug that DLL. At or near the top (depending on your settings) of the Tools menu in Visual Studio is the Attach to Process option. This menu option opens a dialog showing all of your processes. You could then select the process and have the DLL project you want to debug loaded in Visual Studio. The next time your DLL is called by that process, Visual Studio will recognize the call and hit a breakpoint set in your code. This is covered in more detail in Chapter 16.
Other Debug-Related Windows
As noted earlier, when you run an application in Debug mode, Visual Studio can open a series of windows related to debugging. Each of these windows provides a view of a limited set of the overall environment in which your application is running. From these windows, it is possible to find things such as the list of calls (stack) used to get to the current line of code or the present value of all the variables currently available. Visual Studio has a powerful debugger that is fully supported with IntelliSense, and these windows extend the debugger.
Output
Recall that the build process puts progress messages in this window. Similarly, your program can also place messages in it. Several options for accessing this window are discussed in later chapters, but at the simplest level the Console object echoes its output to this window during a debug session. For example, the following line of code can be added to your sample application:
Console.WriteLine("This is printed in the Output Window") This line of code will cause the string “This is printed in the Output Window” to appear in the Output window when your application is running. You can verify this by adding this line in front of the command to open the message box. Then, run your application and have the debugger stop on the line where the message box is opened. If you check the contents of the Output window, you will find that your string is displayed.
Anything written to the Output window is shown only while running a program from the environment. During execution of the compiled module, no Output window is present, so nothing can be written to it. This is the basic concept behind other objects such as Debug and Trace, which are covered in more detail in Chapter 6.
Call Stack
The Call Stack window lists the procedures that are currently calling other procedures and waiting for their return. The call stack represents the path through your code that leads to the currently executing command. This can be a valuable tool when you are trying to determine what code is executing a line of code that you didn't expect to execute.
Locals
The Locals window is used to monitor the value of all variables currently in scope. This is a fairly self-explanatory window that shows a list of the current local variables, with the value next to each item. As in previous versions of Visual Studio, this display enables you to examine the contents of objects and arrays via a tree-control interface. It also supports the editing of those values, so if you want to change a string from empty to what you thought it would be, just to see what else might be broken, then feel free to do so from here.
Watch Windows
There are four Watch windows, numbered Watch 1 to Watch 4. Each window can hold a set of variables or expressions for which you want to monitor the values. It is also possible to modify the value of a variable from within a Watch window. The display can be set to show variable values in decimal or hexadecimal format. To add a variable to a Watch window, you can either right-click the variable in the Code Editor and then select Add Watch from the pop-up menu, or drag and drop the variable into the watch window.
Immediate Window
The Immediate window, as its name implies, enables you to evaluate expressions. It becomes available while you are in Debug mode. This is a powerful window, one that can save or ruin a debug session. For example, using the sample from earlier in this chapter, you can start the application and press the button to stop on the breakpoint. Go to the Immediate window and enter ?TextBoxResult.Text = “Hello World” and press Enter. You should get a response of false as the Immediate window evaluates this statement.
Notice the preceding ?, which tells the debugger to evaluate your statement, rather than execute it. Repeat the preceding text but omit the question mark: TextBoxResult.Text = “Hello World”. Press F5 or click the Run button to return control to your application, and notice the text now shown in the window. From the Immediate window you have updated this value. This window can be very useful if you are working in Debug mode and need to modify a value that is part of a running application.
Autos
Finally, there is the Autos window. The Autos window displays variables used in the statement currently being executed and the statement just before it. These variables are identified and listed for you automatically, hence the window's name. This window shows more than just your local variables. For example, if you are in Debug mode on the line to open the MessageBox in the ProVB_VS2012 sample, then the MessageBox constants referenced on this line are shown in this window. This window enables you to see the content of every variable involved in the currently executing command. As with the Locals window, you can edit the value of a variable during a debug session.
Reusing Your First Windows Form
As you proceed through the book and delve further into the features of Visual Basic, you'll want a way to test sample code. Chapter 2 in particular has snippets of code which you'll want to test. One way to do this is to enhance the ProVB_VS2012 application. Its current use of a MessageBox isn't exactly the most useful method of testing code snippets. So let's update this application so it can be reused in other chapters and at random by you when you are interested in testing a snippet.
At the core you'll continue to access code to test where it can be executed from the ButtonTest Click event. However, instead of using a message box, you can use the resulting text box to hold the output from the code being tested.
. Note that this display has three top-level entries. The first, Data Connections, is the starting point for setting up and configuring the database connection. You can right-click on the top-level Data Connections node and define new SQL Server connection settings that will be used in your application to connect to the database. The Server Explorer window provides a way to manage and view project-specific database connections such as those used in data binding. Server Explorer window
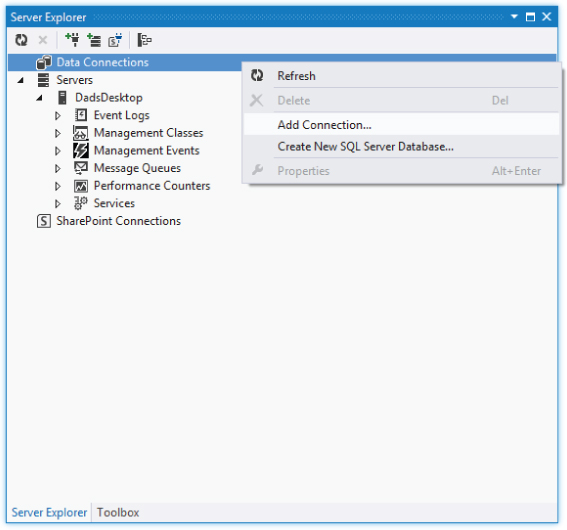
Server Explorer window

The second top-level entry, Servers, focuses on other server data that may be of interest to you and your application. When you expand the list of available servers, you have access to several server resources. The Server Explorer even provides the capability to stop and restart services on the server. Note the wide variety of server resources that are available for inspection or use in the project. Having the Server Explorer available means you don't have to go to an outside resource to find, for example, what message queues are available.
By default, you have access to the resources on your local machine; but if you are in a domain, it is possible to add other machines, such as your Web server, to your display. Use the Add Server option to select and inspect a new server. To explore the Event Logs and registry of a server, you need to add this server to your display. Use the Add Server button in the button bar to open the dialog and identify the server to which you would like to connect. Once the connection is made, you can explore the properties of that server.
The third top-level node, SharePoint Connections, enables you to define and reference elements associated with one or more SharePoint servers for which you might be creating solutions.
Class Diagrams
One of the features introduced with Visual Studio 2005 was the capability to generate class diagrams. A class diagram is a graphical representation of your application's objects. By right-clicking on your project in the Solution Explorer, you can select View Class Diagram from the context menu. Alternatively, you can choose to Add a New Item to your project. In the same window where you can add a new class, you have the option to add a new class diagram. The class diagram uses a .cd file extension for its source files. It is a graphical display, as shown in .
A class diagram
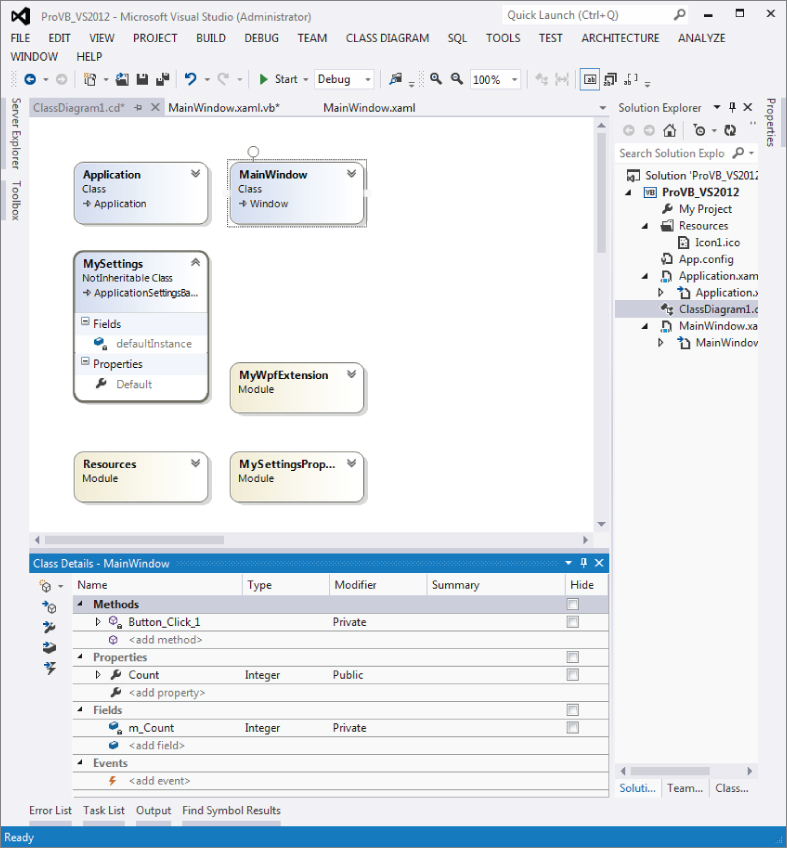
Adding such a file to your project creates a dynamically updated representation of your project's classes. As shown in , the current class structures for even a simple project are immediately represented when you create the diagram. It is possible to add multiple class diagrams to your project. The class diagram graphically displays the relationships between objects—for example, when one object contains another object or even object inheritance. When you change your source code the diagram is also updated. In other words, the diagram isn't something static that you create once at the start of your project and then becomes out-of-date as your actual implementation changes the class relationships.
More important, you can at any time open the class diagram, make changes to one or more of your existing objects, or create new objects and define their relationship to your existing objects, and when done, Visual Studio will automatically update your existing source files and create new source files as necessary for the newly defined objects.
As shown in , the class diagram files (*.cd) open in the same main display area used for the Visual Studio UI designer and viewing code. They are, however, a graphical design surface that behaves more like Visio than the User Interface designer. You can compress individual objects or expose their property and method details. Additionally, items such as the relationships between classes can be shown graphically instead of being represented as properties.
In addition to the editing surface, when working with the Class Designer a second window is displayed. As shown at the bottom of , the Class Details window is generally located in the same space as your Output, Tasks, and other windows. The Class Details window provides detailed information about each of the properties and methods of the classes you are working with in the Class Designer. You can add and edit methods, properties, fields, and even events associated with your classes. While you can't write code from this window, you can update parameter lists and property types. The Class Diagram tool is an excellent tool for reviewing your application structure.
Summary
In this chapter, you have taken a dive into the versions and features of Visual Studio. This chapter was intended to help you explore the new Visual Studio IDE. It demonstrated the powerful features of the IDE.
You've seen that Visual Studio is highly customizable and comes in a variety of flavors. As you worked within Visual Studio, you've seen how numerous windows can be hidden, docked, or undocked. They can be layered in tabs and moved both within and beyond the IDE. Visual Studio also contains many tools, including some that extend its core capabilities.
In the next chapter you will learn more about the runtime environment for .NET, which provides a layer of abstraction above the operating system. Your application runs within this runtime environment. The next chapter looks at how functions like memory management and operating system compatibility are handled in .NET.

