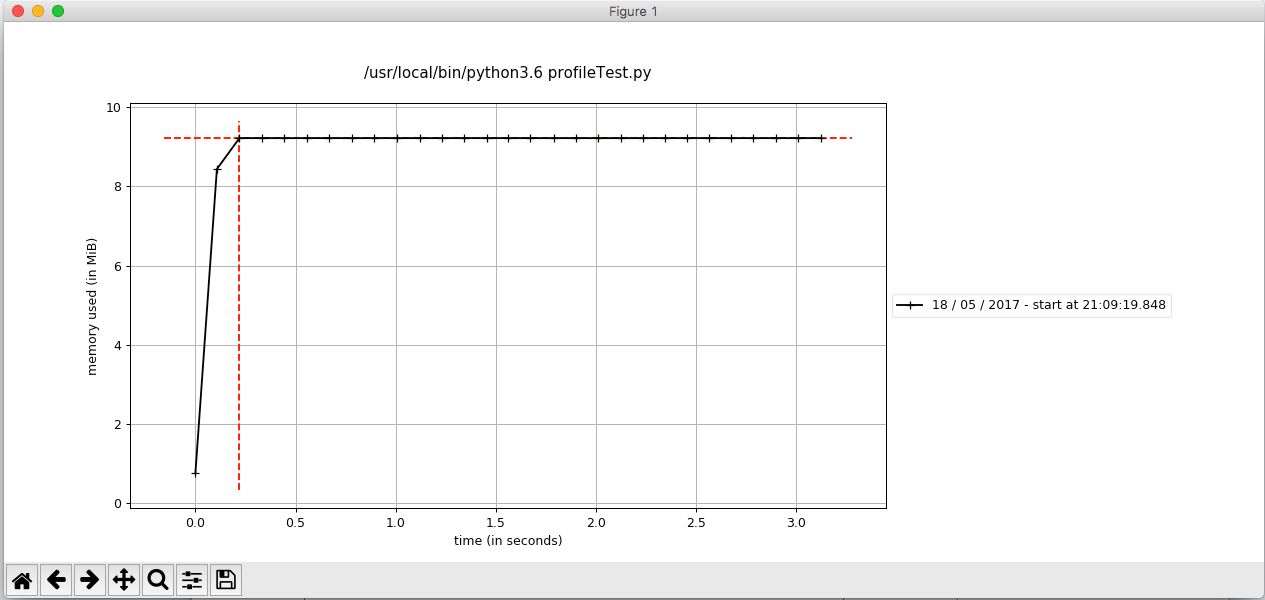
If you want to be able to view your memory usage over a set period of time, then there is the option of using the mprof tool that comes with memory_profiler. The mprof tool takes a series of memory usage samples at a 0.1-second intervals, and then plots this usage into a series of .dat files.
These .dat files can then be used in conjunction with matplotlib in order to show the memory usage of your program over a set period of time.
python -m pip install matplotlib
Now, if you are like me, and you have multiple versions of Python installed on your machine, you might find it a little tricky to get mprof to work. I'm working off macOS, and managed to run mprof using the following command:
$ python3.6 /Library/Frameworks/Python.framework/Versions/3.6/bin/mprof run profileTest.py
This was run against the following code that we've used previously except without the @profile decoration on our slowFunction():
import random
import time

def slowFunction():
  time.sleep(random.randint(1,5))
  print("Slow Function Executed")

def fastFunction():
  print("Fast Function Executed")

def main():
  slowFunction()
  fastFunction()

if __name__ == '__main__':
  main()
Upon completion, we can then run the following command in order to plot our memory usage over time:
$ python3.6 /Library/Frameworks/Python.framework/Versions/3.6/bin/mprof plot

For a very simple program like the preceding one, the graph outputted is somewhat basic, but still, it's a good, simple demonstration for us to pick apart.
On the y-axis, we have the total memory used measured (in MiB), and on the x-axis, we have the time (in seconds). With longer running programs, you should see far more interesting variations in the total memory used, and it should stand you in good stead for trying to identify any memory issues you face further down the line.

