The developers sometimes want to debug the JavaScript in browser, by default, Odoo creates the asset bundles to pack web resources such as JavaScript and Cascading Style Sheets. When they are minified and packed into the bundle it will not be easy to debug them into the browser.
The debug mode is dedicated to enter into the debugging of the assets, and getting access to the technical features and complex features. There are some complex features available on the view, but they are marked as Technical Setting, you have to enter into the debug mode to access those features.
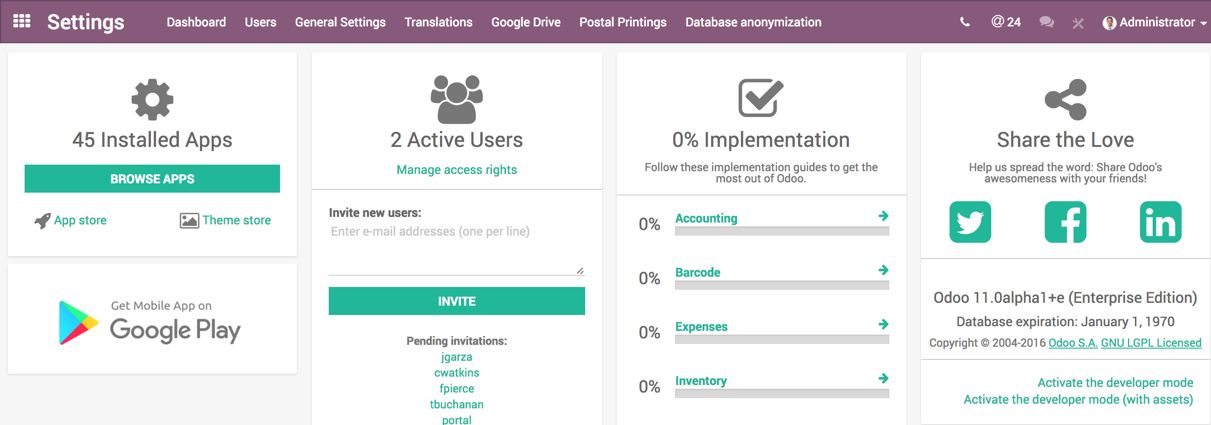
The debug mode, also known as the Developer mode sometimes, it can be activated from the Settings. Enter into the Settings and clicking on Activate the developer mode, it will reload the page and your URL will be changed to https://yourcompany.odoo.com/web?debug=#home:

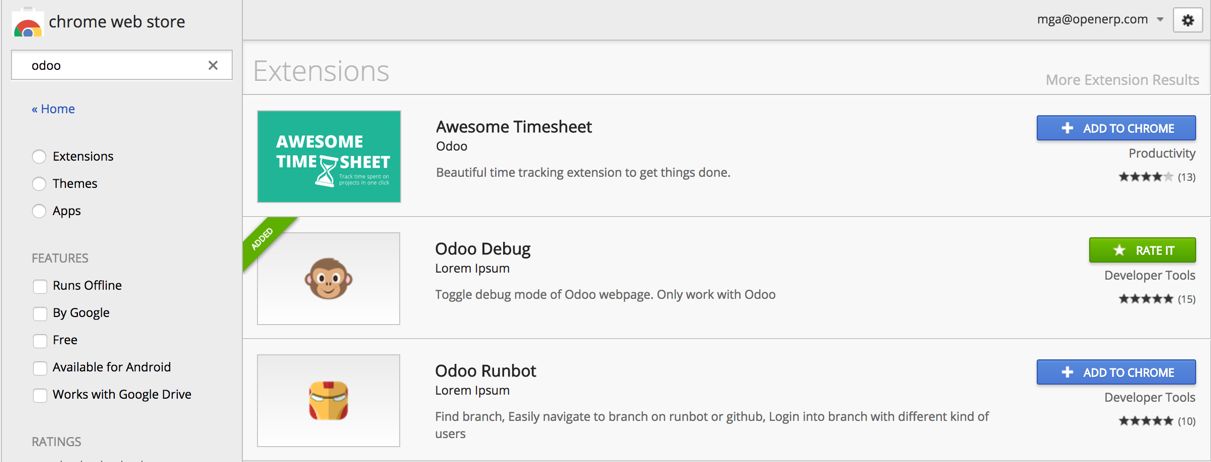
If it is too frequent for you to get access to the debug mode, the another simple way is to install the Google Chrome plugin, so every time you click on the debug icon in Chrome, you will automatically enter into the debug mode. To install the Odoo debug plugin, go to the Chrome apps store and search for Odoo, you will find approximately three apps. Install the Odoo Debug plugin:

When you are on any page within the Odoo application, by clicking on the plugin, you can toggle the debug mode to access the technical feature. By double-clicking the plugin, you can enter debug mode with assets.

