- The analytic accounting feature can be enabled from the Configuration | Settings page of the Accounting application. Search for Analytic accounting under the Accounting and Finance, features group. Select it and click on the APPLY button to enable it:

- The cost center / analytic account can be created by going to Advisor | Analytic Accounting under the Accounting application. You will find the list of analytic accounts created. Click on CREATE to create a new one.
Enter the name in the Analytic Account field. Fill the Reference field and the Customer field if it is related to a specific customer:

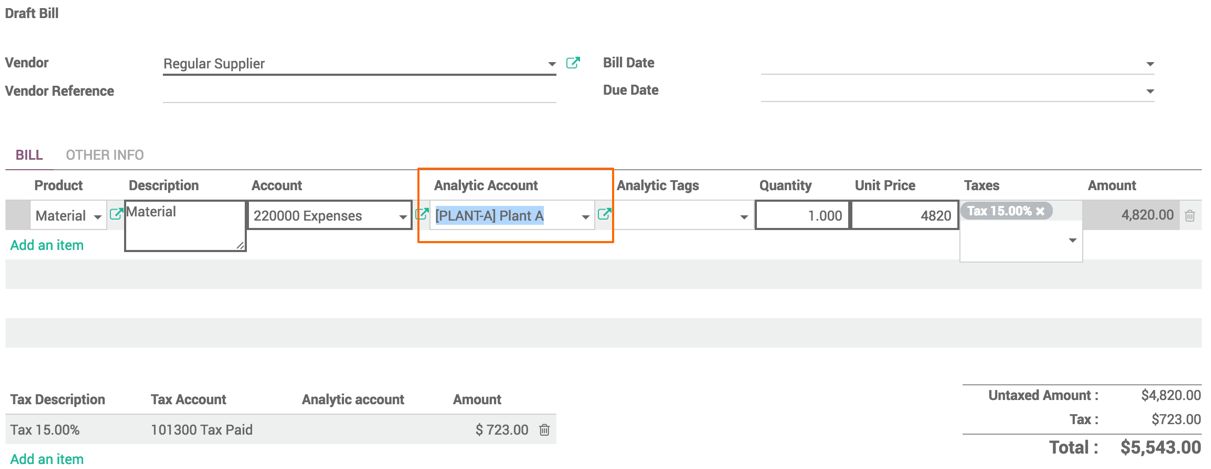
- The team working on the project will fill the timesheet. Purchase of any material dedicated to this project can be entered as a cost, and sales registered to this project can be registered as an income for this project. It will be done automatically. Just select the analytic account at the time of purchase or enter the timesheet entry:

Look at preceding screenshot. The project is selected during the purchase of the material.
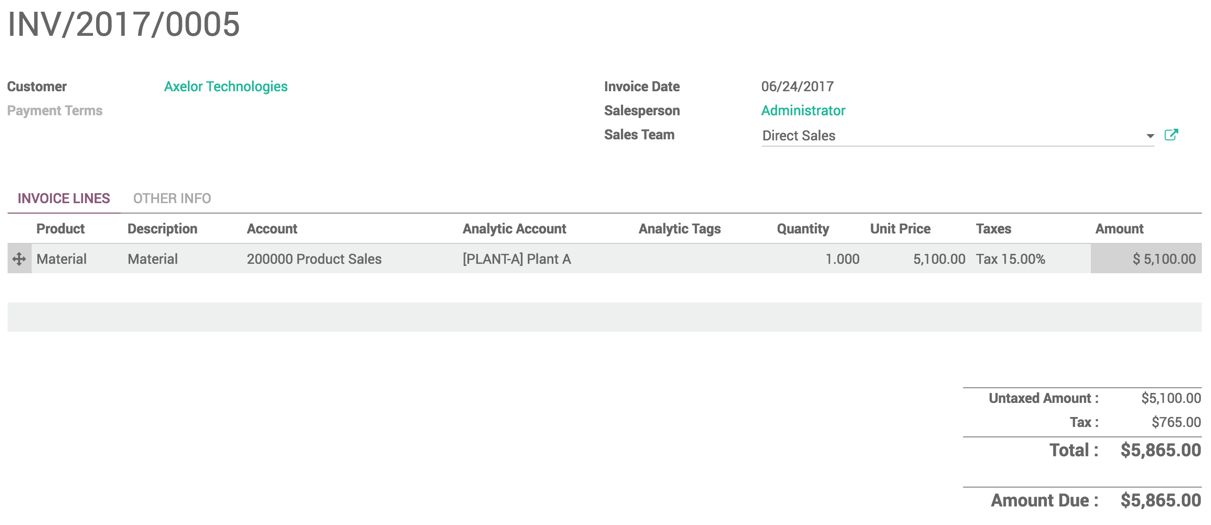
- Link an analytic account at the time of creating an invoice for the project, like with the expense. An income will be registered with the analytic account, and the difference between the revenue and cost will be either profit or loss:

As soon the customer invoice gets confirmed, the analytic entries will be created automatically.
Let's check the analytic accounts. On the list, you can see the total Debit and Credit, and the difference between them as Balance.
Debit represents the expense; Credit represents the income. If the balance is positive, it will be profit; otherwise, a negative balance represents the loss. Look at the following screenshot for the list of analytic accounts:

Like other Odoo views, you can also apply the filter and grouping to generate the statistical reports.
- The detailed list of the income and expense entries can be viewed for the analytic account. Open the form view of the analytic account and click on the Cost / Revenue action button. The reports can be generated from the list view by applying the Group By options, with the default group options applied by month. Look at the screenshot here:

- You can remove the grouping by month, and apply other groupings to get the different reports.

